Recreation Activity Graph – Market and Competitive Advantage Analysis
RJ0600092_12
- Last Update 07/15/2025
- File Size 0.1MB
- # of Slides 2
- File Format PPTX
- Slide Ratio 16:9
- Color
Keywords
About the Product
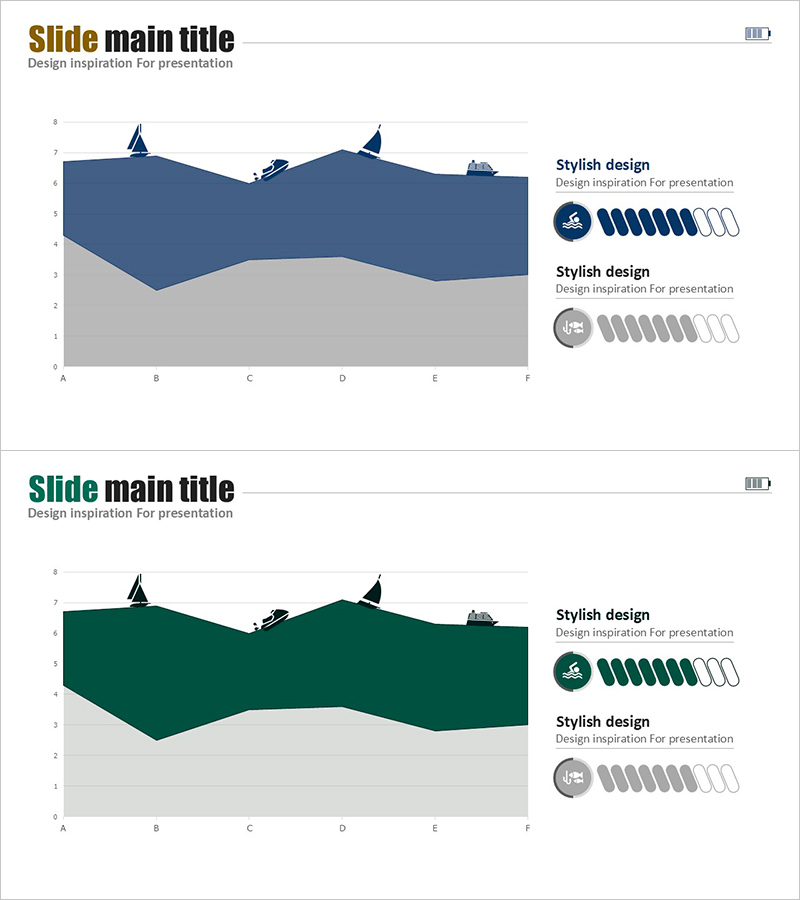
A 2-slide PowerPoint presentation visualizing market position and competitive advantage through a dual-color area chart. The navy and gray layered design compares two data series across six data points (A–F), with progress indicators on the right side showing performance metrics. Ideal for business reports, strategy presentations, and competitive analysis sections in investor pitches. Formatted in 16:9 widescreen for seamless compatibility with modern projectors and displays. Fully editable PPTX template ready for immediate use.
Usage Points
-
Main Usage
Visualizes market landscape and competitive positioning using a two-layer area chart. The navy layer represents market size or competitor performance, while the gray layer shows company performance or competitive strengths. Right-side progress indicators add achievement metrics or goal attainment rates.
-
How to Use
Insert into business reports, strategy presentations, or investor materials in the market analysis section. Replace chart data with actual figures, update title and legend labels to match your document context, and the slide is ready for presentation. Fully editable in PowerPoint.
-
Recommended For
Executives, business development managers, and marketing teams presenting competitive analysis to leadership, investors, or partners. Particularly effective for new market entry strategies, competitive positioning discussions, and strategic decision-making meetings where visual evidence of market advantage is critical.
-
Slide Structure
Two-slide deck with consistent layout: title area at top, dual-color area chart spanning six data points (A–F) in the center, and two-item progress indicator panel on the right. Navy and gray color scheme clearly differentiates data series. Editable text areas include slide title, chart legend, and indicator labels.
Related Products
-

Natural Landscape Illustration Graph – Market Status and Competitive Advantage
#Market and Competitor Analysis #Graph #Other
-

World Travel Template Area Chart
#Market and Competitor Analysis #Graph #Other
-

The Importance of Modern People's Health Care – Insights from Market Analysis
#Market and Competitor Analysis #Graph #Other
-

Graph Trend by Instrument Session – Competitive Analysis Visualization
#Market and Competitor Analysis #Graph #Other
