Graph of Sex Ratio Analysis by Year – Data Visualization and Insights
RJ0300019_9
- Last Update 04/23/2025
- File Size 10.9MB
- # of Slides 2
- File Format PPTX
- Slide Ratio 16:9
- Color
Keywords
- #Content-Based Slides
- #Design-Based Slides
- #Market and Competitor Analysis
- #Graph
- #Customer Analysis
- #Market Analysis
- #Circles
- #Doughnut Chart
- #16:9
- #doughnut chart PowerPoint
- #pie chart template
- #gender ratio analysis slide
- #data visualization presentation
- #comparison chart template
- #donut graph slide design
About the Product
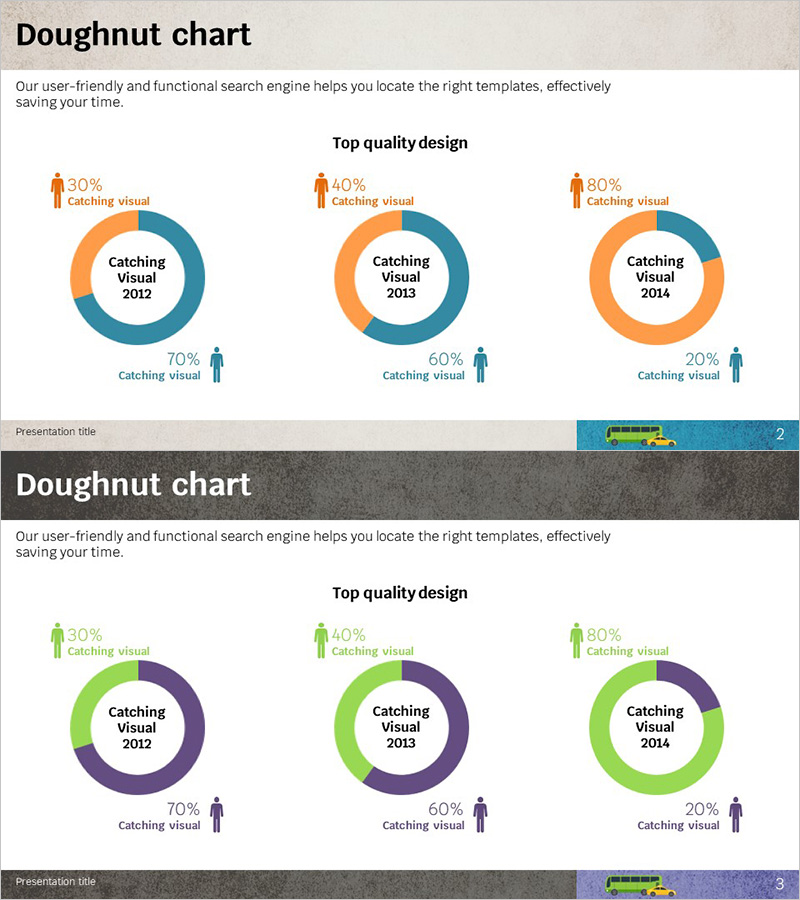
A PowerPoint slide featuring doughnut charts that visualize gender ratio data across three years (2012–2014). The design uses a two-tone color scheme of orange and teal to represent male and female percentages, with percentage labels and gender icons positioned above each chart for intuitive comparison. The center of each doughnut ring provides space for year labels or category text, allowing full customization for your presentation needs. Optimized for 16:9 widescreen format with 2 slides ready to use immediately.
Usage Points
-
Main Usage
Visualize year-over-year gender ratio trends using doughnut charts to communicate data-driven insights. Compare male and female percentages at a glance, making it ideal for market analysis, customer demographics, population statistics, and other data-backed presentations that require visual impact.
-
How to Use
Replace the center text with your year or category label, and update the percentage values with your actual data. Adjust the two-tone colors to match your corporate branding. The gender icons clearly distinguish male and female segments. Insert into the data section of reports, proposals, or analysis presentations for immediate impact.
-
Recommended For
Marketing teams presenting customer demographics, HR departments analyzing workforce composition, research teams sharing market survey results, and executive briefings requiring quantitative analysis. Particularly suited for presentations where year-over-year trend comparison and data-driven decision-making are essential.
-
Slide Structure
2-slide deck with 3 doughnut charts per slide. Each chart features a center ring (for year or category text) and outer doughnut segments (two-tone color ratio display). Percentage labels and gender icons are positioned above each chart to clearly indicate male and female proportions.
Related Products
-

User Analysis Graph by Year – Insights into Customer Behavior
#Market and Competitor Analysis #Graph #Other
-

Happy Kids and Donuts Chart – Enjoyable Market Analysis
#Market and Competitor Analysis #Graph #Customer Analysis
-

Shopping Mall User Gender Ratio Analysis Chart
#Market and Competitor Analysis #Graph #Other
-

Stylish Design Business Presentation Template
#Market and Competitor Analysis #Graph #Market Status
