Separate Recycling Implementation Rate Survey Donut Chart – Visualized in Blue and Green
RJ0600022_9
- Last Update 06/26/2025
- File Size 2.1MB
- # of Slides 2
- File Format PPTX
- Slide Ratio 16:9
- Color
Keywords
- #Content-Based Slides
- #Design-Based Slides
- #Market and Competitor Analysis
- #Graph
- #Customer Analysis
- #Market Analysis
- #Circles
- #Doughnut Chart
- #16:9
- #donut chart PowerPoint
- #donut graph slide template
- #2-segment ratio visualization
- #pie chart PowerPoint slide
- #data visualization presentation template
About the Product
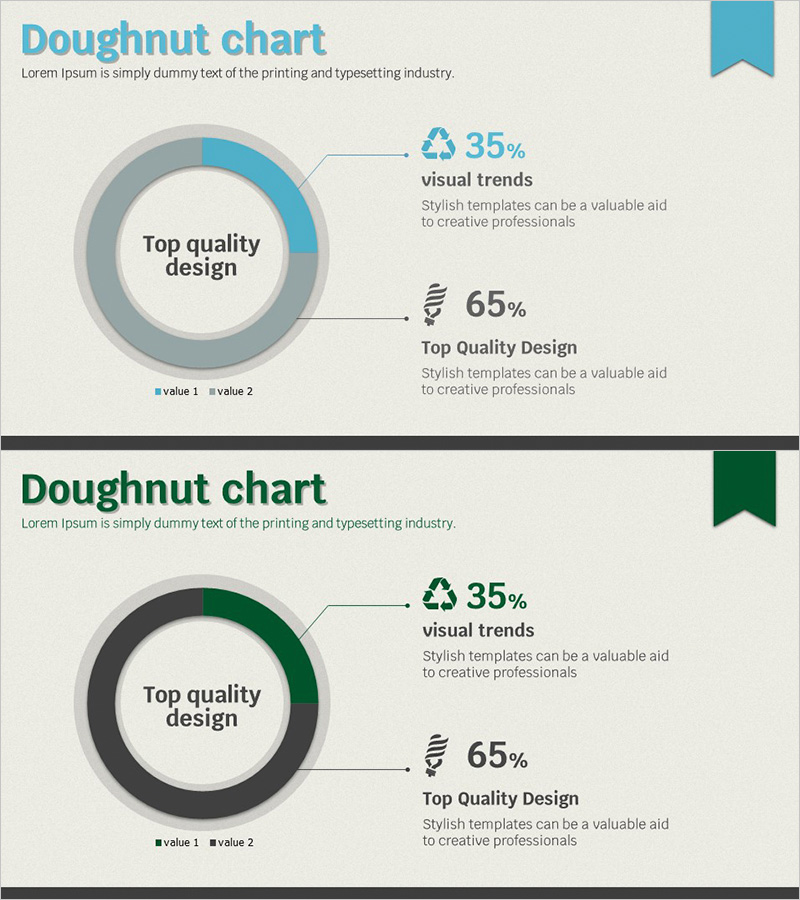
A donut chart PowerPoint slide template designed to visualize the ratio of two data categories, such as recycling implementation rates, customer satisfaction scores, or market share percentages. The center of the donut ring displays a key message, while the outer ring is divided into two segments in blue and green colors to represent data proportions clearly. Each segment is labeled with percentage values and descriptive text connected by leader lines for enhanced information clarity. This 16:9 widescreen template consists of 2 editable slides in PPTX format. It is ideal for business presentations including market analysis, customer insights, survey results, and performance reports.
Usage Points
-
Main Usage
Effectively communicate the proportional relationship between two data categories using a circular ring structure. The donut format allows viewers to instantly grasp the percentage distribution of each segment. The central message area provides visual emphasis, while leader lines connecting percentages and labels ensure clear data interpretation.
-
How to Use
Input your two-category ratio data such as market survey results, customer satisfaction ratings, recycling rates, or product preferences. Customize the blue and green colors to match your corporate brand identity, and edit the percentage values and label text with your own data. The template integrates seamlessly into presentations, reports, proposals, and business documents.
-
Recommended For
Marketing professionals, data analysts, business executives, market researchers, and customer insights teams who need to present two-category ratio data. Particularly effective when emphasizing the composition breakdown of two alternatives or categories in strategic presentations.
-
Slide Structure
2-slide template with 16:9 aspect ratio. Each slide features a donut ring with a central text area for key messaging. The outer ring is divided into two segments: blue (approximately 35%) and green (approximately 65%). Each segment includes an icon, percentage value, and descriptive label connected by leader lines for clear data representation.
Related Products
-

Quality PowerPoint Wide Template Analysis of Men and Women
#Market and Competitor Analysis #Graph #Customer Analysis
-

Market Demand Analysis PowerPoint Slide – Donut Chart Layout
#Market and Competitor Analysis #Graph #Customer Analysis
-

Graph of Sex Ratio Analysis by Year – Data Visualization and Insights
#Market and Competitor Analysis #Graph #Customer Analysis
-

Stylish Design Business Presentation Template
#Market and Competitor Analysis #Graph #Market Status
