Stylish Design Business Presentation Template
RJ0600098_6
- Last Update 07/17/2025
- File Size 0.3MB
- # of Slides 2
- File Format PPTX
- Slide Ratio 16:9
- Color
Keywords
About the Product
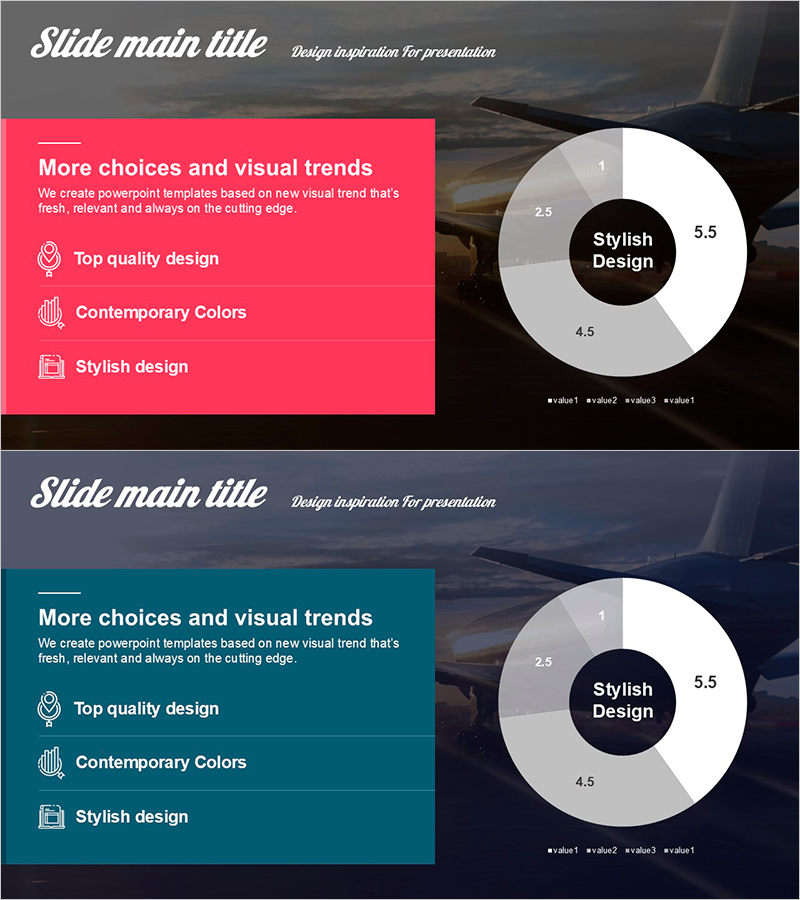
A professional donut chart PowerPoint slide designed for business presentations. Features a pink and teal two-tone background with white and gray donut segments that intuitively display data composition ratios. The 2-slide set combines a left-side text box with key messages and icons alongside a right-side 4-segment donut chart. Ideal for statistics, market analysis, and financial reports, with fully editable text and numerical values to accommodate various data scenarios. Ready to use immediately in quarterly reviews, investor presentations, and data-driven meetings.
Usage Points
-
Main Usage
Visualizes the proportion of each item relative to the whole using a donut chart format. Optimized for expressing market share, revenue composition, customer distribution, and budget allocation. Enables simultaneous comparison and analysis of four data categories with clear visual hierarchy.
-
How to Use
Enter title, description, and key points in the left text box. Edit the donut chart values and legend on the right to reflect actual data. Customize background colors (pink/teal) and chart segments to match corporate branding. Replace icons to align with presentation topic and audience expectations.
-
Recommended For
Recommended for finance teams presenting budget reports, marketing teams analyzing channel performance, sales teams showcasing customer portfolios, and executives delivering quarterly results. Highly effective for data-driven meetings, seminars, investor presentations, and board meetings requiring numerical credibility.
-
Slide Structure
2-slide set. Each slide features a left-side text box (pink or teal background) with title, description, and 3 icons, paired with a right-side 4-segment donut chart (black center circle + 4 colored segments + legend). Optimized for 16:9 widescreen format compatible with modern projectors and displays.
Related Products
-

Visual Insights on Education Analysis PowerPoint
#Market and Competitor Analysis #Diagram #Graph
-

Separate Recycling Implementation Rate Survey Donut Chart – Visualized in Blue and Green
#Market and Competitor Analysis #Graph #Customer Analysis
-

User Analysis Donut Chart – Optimal for Market and Competitor Analysis
#Market and Competitor Analysis #Graph #Other
-

Triple Blue Green Donut Chart – Visual Data Analysis
#Market and Competitor Analysis #Graph #Market Status
