A Bar Graph Showing Future Prospects
RJ0300019_6
- Last Update 04/23/2025
- File Size 11MB
- # of Slides 2
- File Format PPTX
- Slide Ratio 16:9
- Color
Keywords
About the Product
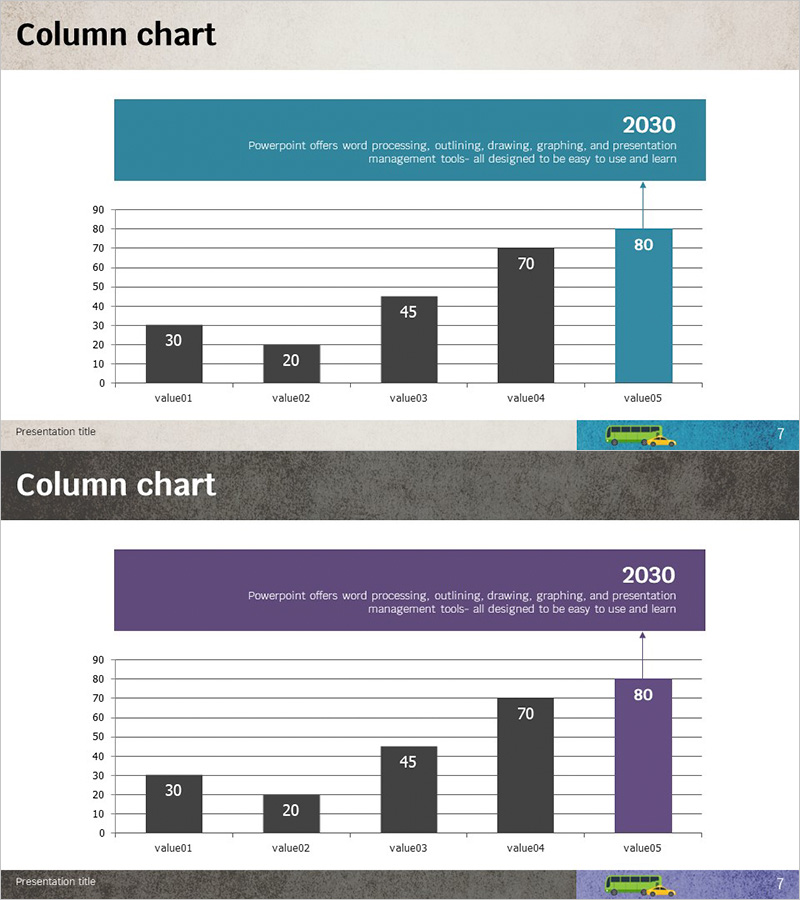
A vertical bar chart PowerPoint slide designed to visualize future prospects and market data across five comparable items. The final bar is highlighted in teal to emphasize key metrics, while the first four bars use grayscale tones to represent baseline data. An information box at the top displays the year and descriptive text, creating a professional layout suitable for business presentations. This slide template is ready to use in competitive analysis, market trend reports, and performance comparison presentations. Provided in 16:9 widescreen PPTX format with two color variations.
Usage Points
-
Main Usage
Display and compare five data points such as future prospects, market metrics, or competitive benchmarks in a single visual. The teal highlight on the final bar draws attention to the most critical value, while the information box at the top provides context through year labels and descriptive text.
-
How to Use
Insert this slide into business reports, market analysis presentations, or executive briefings where numerical comparisons are essential. Modify the bar heights to represent your actual data values, use the teal accent bar to emphasize the highest value or target goal, and update the top text box with relevant year, quarter, or regional information.
-
Recommended For
Finance professionals, marketing strategists, business analysts, and management consultants who present data-driven insights. Ideal for quarterly performance reviews, regional sales comparisons, competitive benchmarking reports, and strategic planning presentations.
-
Slide Structure
Top section features a teal information box with year and descriptive text. Main chart area contains a vertical bar graph with Y-axis range (0–90) and X-axis with five items (value01–value05). First four bars in grayscale; final bar in teal accent. Two slide variations with different color schemes (teal and purple) included.
Related Products
-

Idea Development Future Outlook Graph – Essential Template for Market Analysis
#Market and Competitor Analysis #Graph #Future Outlook
-

Blue Red Analysis Chart – New Insights into Market Analysis
#Market and Competitor Analysis #Diagram #Graph
-

Future Outlook Analysis Bar Graph – Essential for Market Analysis
#Market and Competitor Analysis #Graph #Future Outlook
-

Data Visualization through Vertical Bar Graph – Effective Presentation
#Market and Competitor Analysis #Graph #Future Outlook
