Idea Development Future Outlook Graph – Essential Template for Market Analysis
RJ0400059_17
- Last Update 06/02/2025
- File Size 1.9MB
- # of Slides 2
- File Format PPTX
- Slide Ratio 16:9
- Color
Keywords
About the Product
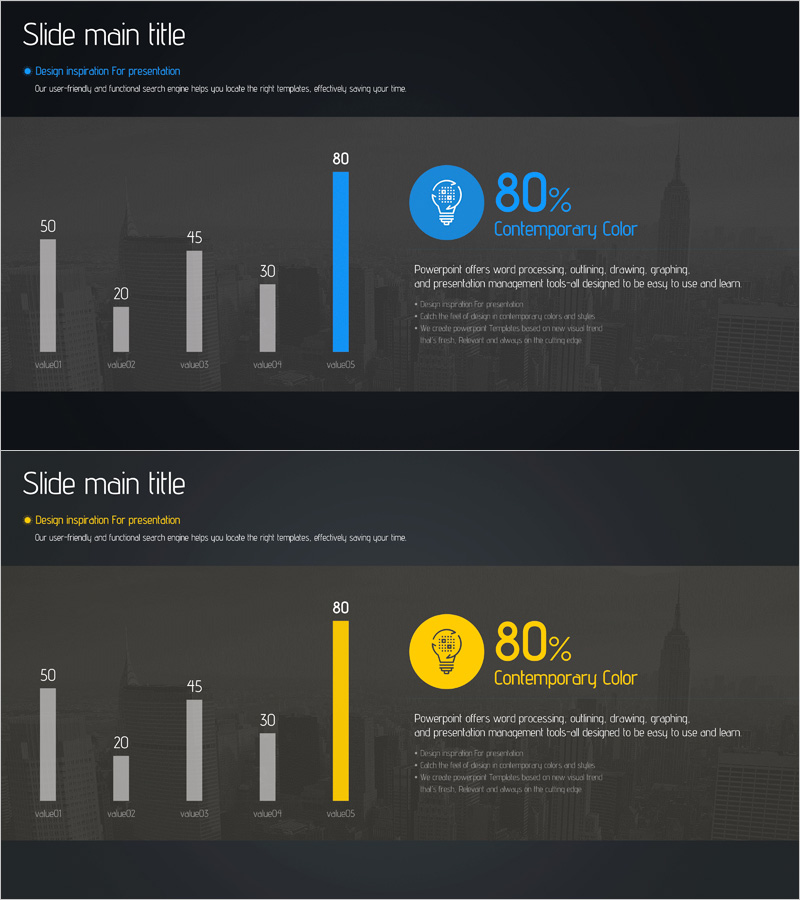
An essential vertical bar chart PowerPoint slide for market analysis and idea development presentations. This slide deck features five data items displayed as comparable bars on a dark background, with blue and yellow accent colors highlighting key metrics. Each slide includes percentage indicators and icon-based description areas, making it ready to use in presentations, reports, and business proposals. The 2-slide set offers multiple color variations optimized for 16:9 widescreen format, allowing you to visualize quantitative data clearly and compare performance across different categories.
Usage Points
-
Main Usage
Display quantitative data for market analysis, idea development, and future outlook comparisons. The vertical bar format allows viewers to instantly grasp relative values and rankings across five categories, while percentage labels provide additional ratio context for comprehensive data storytelling.
-
How to Use
Input your actual data values into the slide, and the bar heights automatically adjust proportionally. Use the blue bars for baseline metrics and yellow bars to emphasize key performance indicators. Customize the text areas with category names and descriptions to align with your presentation narrative.
-
Recommended For
Marketing managers, business analysts, strategists, and executives presenting market conditions, competitive analysis, or performance metrics. Ideal for business plans, quarterly reports, investor presentations, and strategic planning meetings.
-
Slide Structure
Slide 1: Five blue-accent vertical bars with percentage labels and right-side icon-text area / Slide 2: Five yellow-accent bars with identical layout. Both slides feature dark backgrounds with clear axis labels and legend elements for professional data visualization.
Related Products
-

Business Future Outlook Analysis Diagram - Market Analysis and Competitive Advantage
#Market and Competitor Analysis #Graph #Future Outlook
-

Future Outlook Bar Graph – Visualizing Market Growth
#Market and Competitor Analysis #Graph #Future Outlook
-

Rise and Fall Vertical Bar Graph – Essential for Market Analysis
#Market and Competitor Analysis #Graph #Future Outlook
-

Blue Red Analysis Chart – New Insights into Market Analysis
#Market and Competitor Analysis #Diagram #Graph
