Market Analysis by Year Visualization with Bar Charts
RJ0300019_15
- Last Update 04/22/2025
- File Size 10.9MB
- # of Slides 2
- File Format PPTX
- Slide Ratio 16:9
- Color
Keywords
- #Content-Based Slides
- #Design-Based Slides
- #Market and Competitor Analysis
- #Graph
- #Market Analysis
- #Horizontal Bar
- #Grouped Horizontal Bar
- #16:9
- #horizontal bar chart PowerPoint
- #time series data visualization slide
- #market analysis chart template
- #year-over-year comparison
- #multi-series bar graph
- #business data PowerPoint slide
- #how to create bar chart in PowerPoint
About the Product
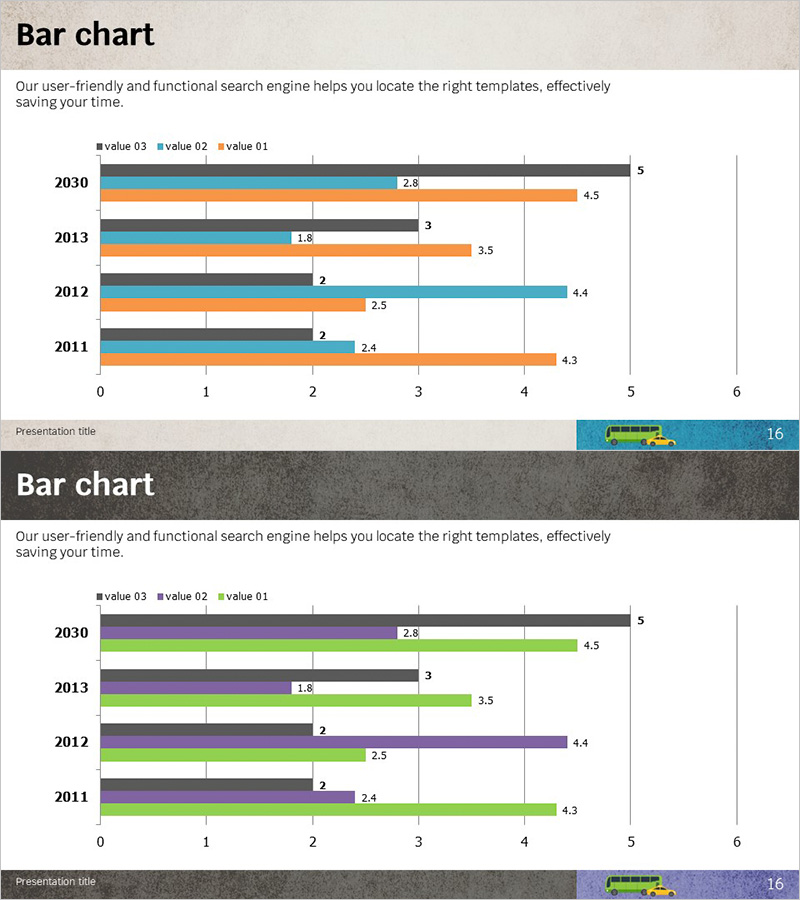
A horizontal bar chart PowerPoint slide designed to visualize market trends across multiple years and data series. This presentation template displays five years of data (2011–2030) with three distinct value series (value 01, 02, 03) arranged side-by-side for easy year-over-year and cross-series comparison. The light gray background combined with blue, orange, and black bars creates a professional appearance suitable for business analysis, quarterly reports, and performance presentations. The 16:9 widescreen format includes two slides ready for immediate data input and presentation delivery.
Usage Points
-
Main Usage
Enables simultaneous comparison of market trends across multiple years and key performance indicators. The color-coded data series allow viewers to quickly identify year-over-year changes and relative differences between metrics at a glance.
-
How to Use
Insert this slide in the market analysis section to compare competitive performance trends, or use it in business reports to illustrate annual changes in revenue, customer metrics, or market share. Simply replace the existing data values and legend labels with your own figures to create a presentation-ready slide.
-
Recommended For
Marketing, sales, and strategy professionals presenting market conditions and competitive analysis to executives, clients, and investors. Also effective for financial reports, performance reviews, and multi-year business plan presentations where trend visualization is critical.
-
Slide Structure
Two-slide set with consistent layout: Y-axis displays five years (2011–2030), X-axis shows numerical scale (0–6). Three data series represented by color-coded horizontal bars with numerical labels at bar endpoints for precise data representation and easy reference.
Related Products
-

White Black Bundle Horizontal Bar Graph
#Market and Competitor Analysis #Graph #Market Analysis
-

Travel Guide Market Analysis by State in the United States Using Horizontal Bar Chart
#Market and Competitor Analysis #Graph #Other
-

Cybersecurity Business Market Analysis Graph
#Market and Competitor Analysis #Graph #Competitor Analysis
-

Management Performance Analysis Bundle Chart
#Business Strategy #Market and Competitor Analysis #Graph
