Company Status Analysis Slide – Market and Competitor Analysis
RM0300014_7
- Last Update 02/10/2025
- File Size 2.9MB
- # of Slides 2
- File Format PPTX
- Slide Ratio 16:9
- Color
Keywords
- #Content-Based Slides
- #Design-Based Slides
- #Company Introduction
- #Market and Competitor Analysis
- #Graph
- #Shareholder Structure
- #Market Analysis
- #Horizontal Bar
- #Grouped Horizontal Bar
- #16:9
- #horizontal bar chart PowerPoint
- #grouped bar graph template
- #market analysis slide
- #competitor analysis PPT
- #business status presentation
- #comparison chart slide
About the Product
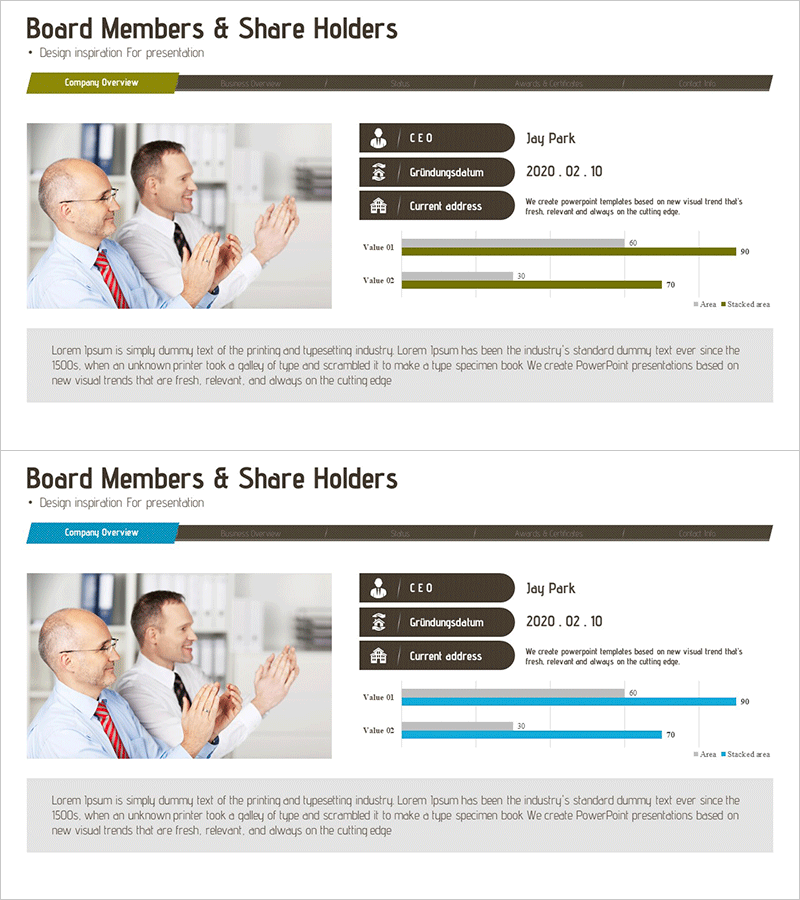
A 2-slide PowerPoint presentation template designed for corporate status analysis with grouped horizontal bar charts. The design features an olive-green primary color palette paired with dark brown backgrounds, creating a professional and authoritative appearance. Each slide contains two horizontal bar charts positioned side-by-side, enabling direct comparison of market and competitor data across identical metrics. The template is provided in 16:9 widescreen PPTX format and is ready for immediate use in executive presentations, investor pitch decks, and quarterly business reviews. The text and data input areas are clearly delineated, making it simple to edit and customize with your own figures and labels.
Usage Points
-
Main Usage
This slide template is designed to compare your company's market position and competitive standing using data-driven horizontal bar charts. The side-by-side arrangement of two bar graphs allows viewers to instantly grasp performance differences across the same metrics, making it ideal for executive briefings, investor presentations, and strategic planning sessions where competitive advantage must be clearly demonstrated.
-
How to Use
Input your actual data (revenue, market share, customer satisfaction scores, etc.) into each horizontal bar chart. Modify the legend and axis labels to reflect your specific analysis categories, and maintain the olive-green color scheme while adding accent colors if needed for emphasis. Use the first slide for market analysis and the second for competitor benchmarking, or adapt the structure to your presentation flow.
-
Recommended For
Executive teams and strategy departments conducting market analysis during strategic planning phases; IR professionals presenting competitive positioning to investors; planning and business intelligence teams preparing quarterly or annual business reviews; management consultants visualizing benchmarking data in client reports; product managers comparing market segments and competitor offerings.
-
Slide Structure
The template consists of 2 slides, each featuring an olive-green header banner (labeled 'Company Overview') and a dark brown information area below. Each slide displays 2 grouped horizontal bar charts (Value 01 and Value 02) arranged horizontally, with capacity for 5–6 data items per chart. Legend and numerical value indicators are positioned on the right side of each chart for clarity and balance.
Related Products
-

Astronomy Themed Bundle Bar – Market Analysis Slide
#Market and Competitor Analysis #Graph #Market Analysis
-

Market Status and Trends Horizontal Bar Chart Slide
#Market and Competitor Analysis #Graph #Other
-

White Black Bundle Horizontal Bar Graph
#Market and Competitor Analysis #Graph #Market Analysis
-

In-depth Analysis Diagrams & Charts – Insightful Technical Analysis
#Technical Approach #Market and Competitor Analysis #Diagram
