Kids’ Study Time Planner – Market Share Visualization
RB0300029_4
- Last Update 03/10/2025
- File Size 0.6MB
- # of Slides 2
- File Format PPTX
- Slide Ratio 4:3
- Color
Keywords
About the Product
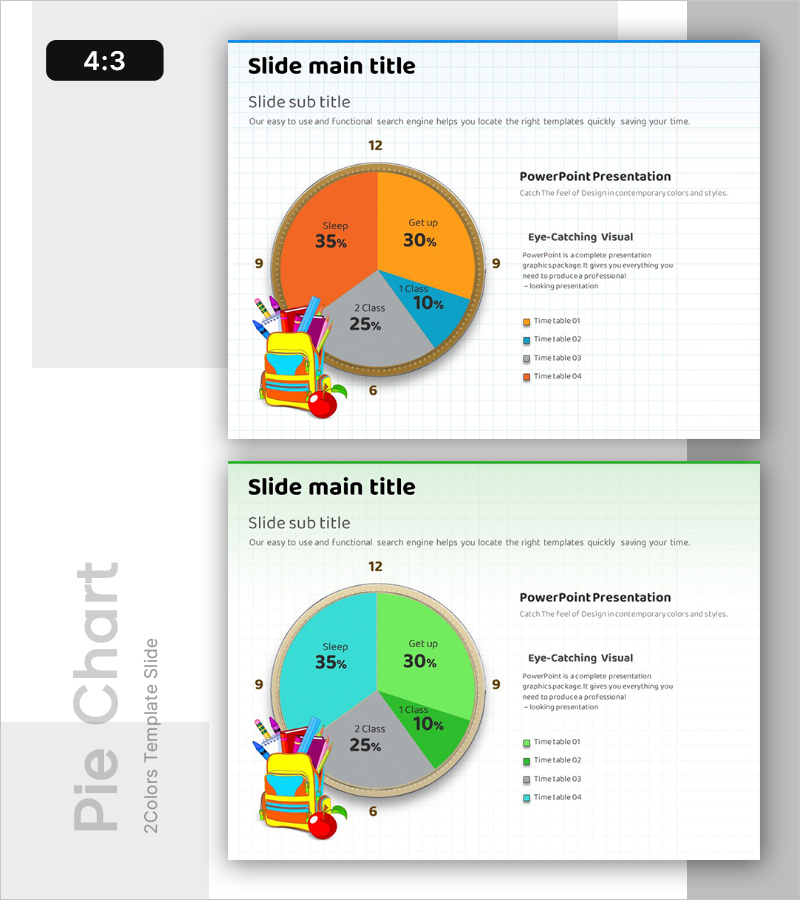
A pie chart PowerPoint slide that divides children's study time planning into 4 segments. The chart uses orange (Sleep 35%), yellow (Get up 30%), blue (1st Class 10%), and gray (2nd Class 25%) to intuitively represent time allocation. A background grid, clock icon, and backpack illustration emphasize the learning theme, while a legend clearly distinguishes each item. The 2-slide set provides color variations (orange-blue palette and green-blue palette) so you can choose based on your presentation context. Available in 4:3 ratio PPTX format for immediate editing.
Usage Points
-
Main Usage
Visualizes children's study time allocation, daily schedule composition, and time management planning using a pie chart. Each activity's required time is expressed as a ratio, allowing viewers to grasp time distribution balance at a glance. Ideal for parent consultations, study plan presentations, and educational seminars.
-
How to Use
Open the slide and replace the legend text and numbers with your own data. The clock numbers (12, 9, 6) and icons are decorative elements emphasizing the learning theme and can be deleted if needed. Choose between 2 color variations that match your presentation tone.
-
Recommended For
Elementary school parents, education instructors, learning management specialists, child psychology counselors, and education department officials can use this for time management education, study plan presentations, and child development seminars. Also suitable as educational material for children.
-
Slide Structure
A pie chart structure divided into 4 segments. Each segment is marked with different colors (orange 35%, yellow 30%, blue 10%, gray 25%), with a legend and text description area positioned on the right. A clock icon and backpack illustration are placed in the lower left to emphasize the learning theme.
Related Products
-

Detailed Regional Analysis Chart – Market Share Visualization
#Market and Competitor Analysis #Graph #Market Share
-

Market Share Analysis Graph – Effective Market Insights
#Market and Competitor Analysis #Graph #Market Share
-

Target Market Share Analysis – Visualizing Market Analysis with Pie Chart
#Market and Competitor Analysis #Graph #Other
-

App Payment Service Market Analysis Graph – Visualizing Market Share
#Market and Competitor Analysis #Graph #Market Share
