Segmented Bar Graph for Market Competition Analysis – Data-Driven Insights
RJ0300018_17
- Last Update 04/22/2025
- File Size 2.6MB
- # of Slides 2
- File Format PPTX
- Slide Ratio 16:9
- Color
Keywords
- #Content-Based Slides
- #Design-Based Slides
- #Market and Competitor Analysis
- #Graph
- #Market Analysis
- #Competitive Advantage
- #Horizontal Bar
- #Segmented Horizontal Bar
- #16:9
- #segmented horizontal bar chart
- #bar graph PowerPoint
- #market competition analysis presentation
- #data comparison slide
- #chart PowerPoint template
About the Product
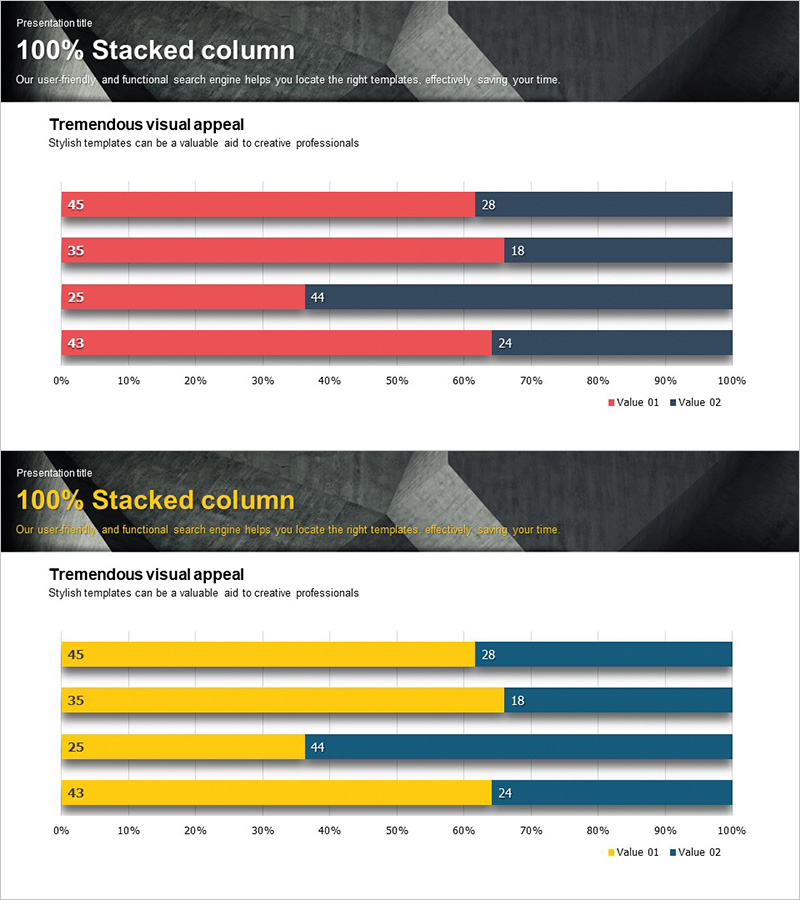
A segmented horizontal bar chart PowerPoint slide optimized for market competition analysis. This presentation template visualizes contrasting data using red and blue color series, comparing four items with numerical values displayed horizontally. Each item shows two data points (Value 01 and Value 02) simultaneously, making it ideal for competitive benchmarking, market share comparison, and performance metrics visualization. The 16:9 widescreen format includes 2 fully editable slides in PPTX format, ready for immediate customization.
Usage Points
-
Main Usage
Visualize competitive benchmarking, market share distribution, and performance metrics using horizontal bar segments. The dual-color series (red-blue) enables simultaneous comparison of two indicators, supporting data-driven decision-making presentations.
-
How to Use
Use in business presentations, marketing strategy meetings, executive reports, and market analysis briefings to explain competitive positioning. Simply edit the slide values and labels with your own data for immediate deployment in professional presentations.
-
Recommended For
Marketing managers, strategic planning teams, sales directors, and business analysts presenting competitive analysis, market conditions, and performance comparisons. Ideal when comparing two metrics side-by-side across multiple categories.
-
Slide Structure
Four items (45, 35, 25, 43) each display two data series (Value 01, Value 02) as horizontal stacked bars. The layout includes a 0-100% horizontal axis, item labels, and numerical values. Two slide variations provided: red-blue color scheme and yellow-blue color scheme.
Related Products
-

Horizontal Segmentation Bar Graph for Market Analysis – Competitive Advantage Structure
#Market and Competitor Analysis #Graph #Market Analysis
-

Segmented Bar Graph for Market Analysis Visualization
#Market and Competitor Analysis #Graph #Market Analysis
-

Hologram Wide PPT Streamlined Graph
#Market and Competitor Analysis #Graph #Future Outlook
-

Medical Market Analysis Bar Segmentation Graph
#Market and Competitor Analysis #Graph #Market Analysis
