Horizontal Bar Chart for Construction Project Performance Analysis – Stability and Growth
RJ0900017_21
- Last Update 08/20/2025
- File Size 0.3MB
- # of Slides 2
- File Format PPTX
- Slide Ratio 16:9
- Color
Keywords
- #Content-Based Slides
- #Design-Based Slides
- #Market and Competitor Analysis
- #Diagram
- #Graph
- #Market Analysis
- #Competitive Advantage
- #Cluster
- #Horizontal Bar
- #Combination Diagram
- #Grouped Horizontal Bar
- #16:9
- #horizontal bar chart PowerPoint
- #grouped bar graph presentation
- #construction project performance slide
- #year-over-year data comparison PPT
- #growth trend analysis chart
About the Product
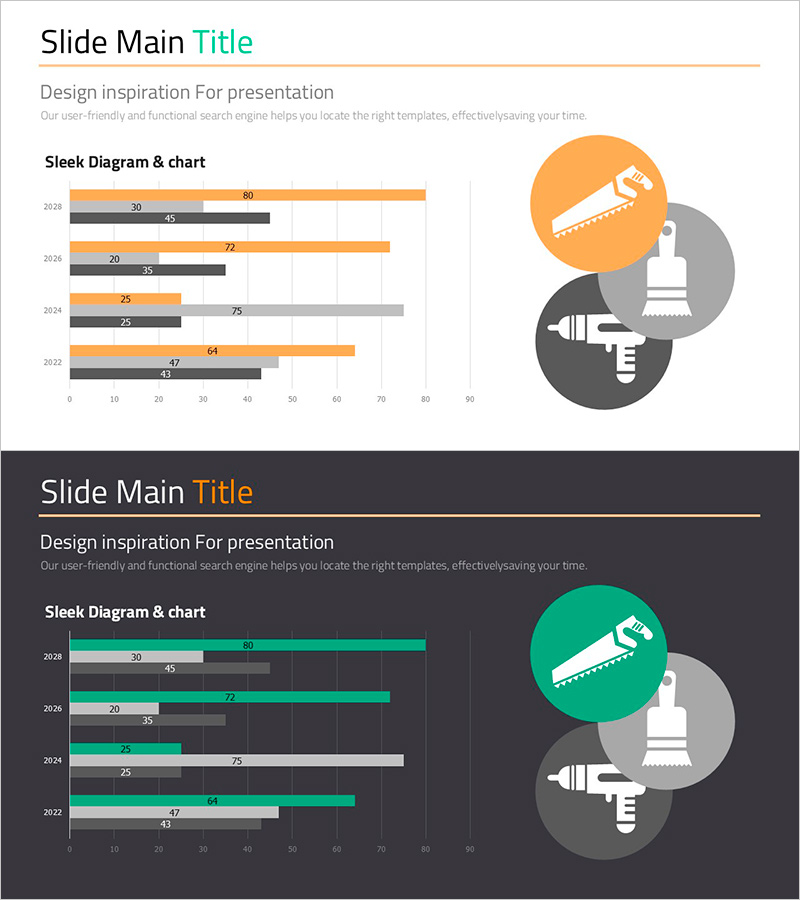
A horizontal bar chart PowerPoint slide designed for analyzing construction project performance and business results. This presentation template visualizes data from 2022 to 2028 across four years using two data series in orange and gray, effectively displaying both growth trends and stability. The grouped bar structure places two items side by side for each year, enabling intuitive numerical comparison. Two versions are included—one with a light background and one with a dark background—allowing you to select the version that best suits your presentation environment. This slide deck is ready to use for performance reporting, market analysis, and competitive advantage presentations in construction, real estate, and project management sectors.
Usage Points
-
Main Usage
This slide clearly compares year-over-year construction project performance and business results. By placing two data series side by side, it simultaneously displays growth rates and stability, delivering a compelling narrative to investors, executives, and clients about business achievements.
-
How to Use
Use this slide in business performance reports, quarterly and annual results presentations, and investor pitch decks within the market analysis section. Edit the numerical values on each bar with your actual data, and customize the series colors to match your company's brand palette if needed. Select either the light or dark background version based on your presentation venue's lighting and screen setup.
-
Recommended For
Ideal for construction and real estate company executives, project managers, and sales professionals presenting performance reports and results. Also effective for consulting firms, financial institutions conducting industry analysis, and government agencies preparing policy reports.
-
Slide Structure
Two-slide set, each displaying data from 2022 to 2028 across four years as horizontal bars. For each year, an orange bar (primary metric) and a gray bar (comparison metric) are positioned side by side, with numerical labels displayed at the bar ends. One slide features a light background and the other a dark background for flexible use.
Related Products
-

Audio Icons and Comparison Graphs – A New Dimension in Market Analysis
#Market and Competitor Analysis #Graph #Market Analysis
-

Visualizing Business Strategy with Bar Charts – Market Analysis and Future Outlook
#Market and Competitor Analysis #Diagram #Graph
-

Travel Guide Market Analysis by State in the United States Using Horizontal Bar Chart
#Market and Competitor Analysis #Graph #Other
-

Market Analysis Graph by Year – Visualizing Competitive Advantage
#Market and Competitor Analysis #Graph #Market Analysis
