Modern Theme Income Statement Table
RJ0300018_15
- Last Update 04/22/2025
- File Size 2.6MB
- # of Slides 2
- File Format PPTX
- Slide Ratio 16:9
- Color
Keywords
About the Product
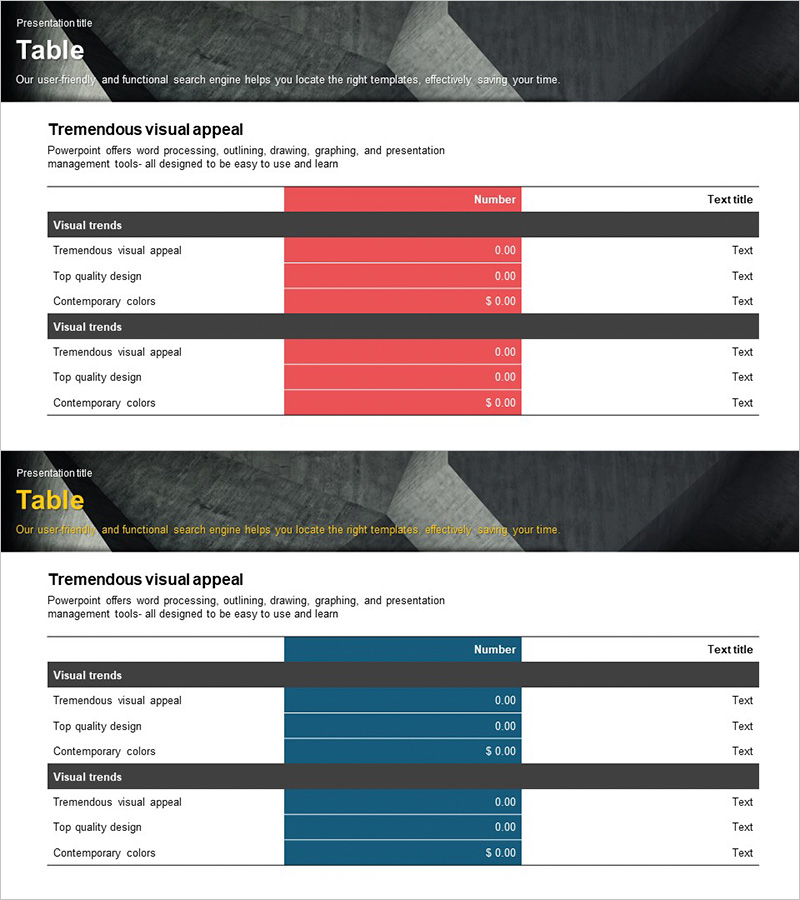
A horizontal bar income statement table PowerPoint slide designed to present financial data with clarity and impact. The design features red and dark gray color scheme that emphasizes numerical values, with clear separation between left-side item labels and right-side data visualization. The 2-slide set enables comparative financial analysis using identical layouts, optimized for 16:9 widescreen format. Perfect for financial reports, business plans, investor presentations, and quarterly earnings calls where numerical accuracy and visual hierarchy are essential.
Usage Points
-
Main Usage
Visualize financial performance and profitability analysis through a structured income statement table. The horizontal bar format enables quick comparison of revenue, expenses, and profit metrics. Effectively communicate financial health and business viability to investors, stakeholders, and internal teams.
-
How to Use
Insert into financial sections of business plans, quarterly or annual financial reports, investor relations (IR) presentations, and executive briefing decks. Replace sample data with actual income statement figures. The red bars highlight key metrics while dark backgrounds emphasize category labels for improved readability.
-
Recommended For
CFOs, financial controllers, business executives, and investor relations professionals presenting financial performance. Ideal for startup fundraising pitches, corporate earnings announcements, financial analysis meetings, and business proposal documents.
-
Slide Structure
Two-slide set with identical table layouts for comparative analysis. Each slide features a left section with item labels on dark background and a right section with red horizontal bars representing numerical values. Accommodates 3-4 financial line items (revenue, cost of goods sold, operating income, etc.). Fully compatible with 16:9 widescreen presentation format.
Related Products
-

Profit Analysis Graph – Visualizing Financial Performance
#Financial Plans and Performance #Diagram #Income Statement
-

Sales and Profit Calculation Table – Efficient Profit Management
#Financial Plans and Performance #Diagram #Income Statement
-

Sales and Profit Table – Visualizing Financial Performance
#Financial Plans and Performance #Diagram #Other
-

Visualizing Financial Performance with Business Table Chart – Intuitive and Effective
#Financial Plans and Performance #Diagram #Income Statement
