Market Analysis Graph for Business Success
RJ0300018_13
- Last Update 04/22/2025
- File Size 2.8MB
- # of Slides 2
- File Format PPTX
- Slide Ratio 16:9
- Color
Keywords
- #Content-Based Slides
- #Design-Based Slides
- #Business Strategy
- #Market and Competitor Analysis
- #Graph
- #Achievements
- #Market Analysis
- #Line
- #Line Chart
- #16:9
- #line chart PowerPoint slide
- #trend analysis presentation template
- #time series data visualization
- #business performance graph
- #dual-axis chart download
About the Product
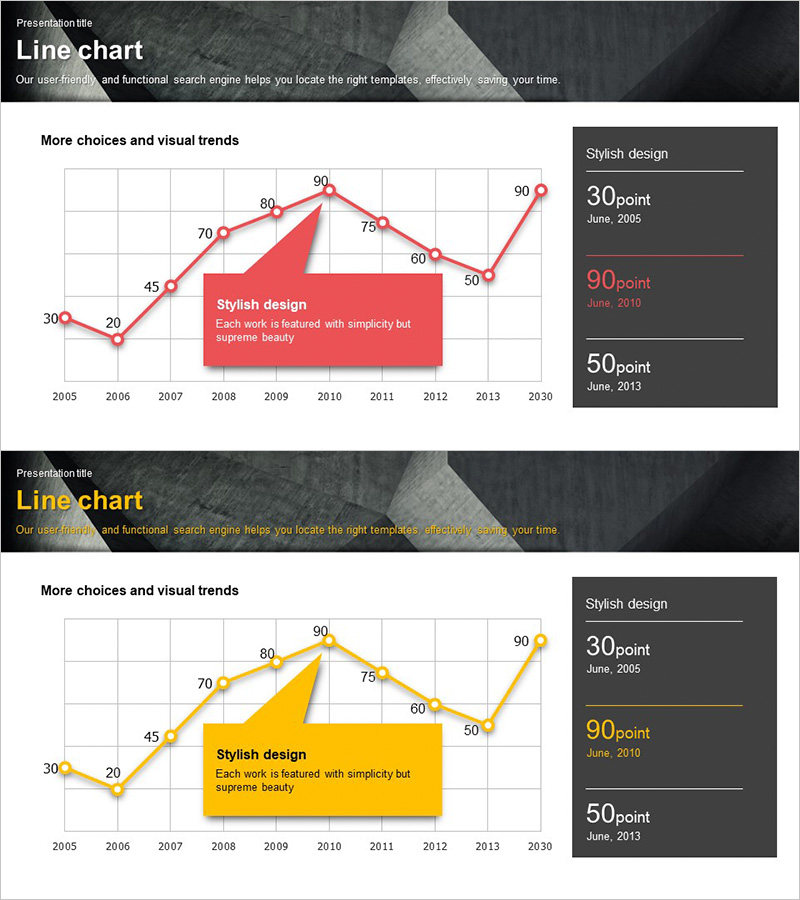
A professional line chart PowerPoint slide visualizing long-term trend changes from 2005 to 2030 with dual-color data series (red and yellow). Each data point is clearly labeled with numerical values (30–90 points), making it ideal for market analysis, business performance reports, and growth trajectory presentations. The grid background provides clear reference lines, while the right-side information box highlights key milestone values to emphasize critical insights. Fully editable in 16:9 widescreen PPTX format for immediate customization and integration into business presentations.
Usage Points
-
Main Usage
Effectively visualize numerical changes over extended periods to communicate market analysis, business performance metrics, revenue trends, customer satisfaction evolution, and other time-series data. The dual-series design enables simultaneous comparison of two independent datasets, making it ideal for competitive benchmarking and actual-versus-target performance analysis.
-
How to Use
Insert into business strategy presentations, quarterly or annual performance reports, market research findings, and investor pitch decks within the data visualization section. Replace each data point and numerical label with your actual figures. Adjust the color scheme to match your corporate brand identity for consistent visual communication.
-
Recommended For
Marketing professionals, business planning teams, financial analysts, executive report managers, management consultants, and academic presenters who need to communicate data-driven insights persuasively. Particularly effective for strategic planning phases requiring long-term trend analysis and stakeholder alignment.
-
Slide Structure
Title area at top, central line chart with 2 data series (approximately 10 data points each), grid background for reference, right-side information box highlighting 3 key milestone values. Includes flexible space for additional text annotations above the chart. Two-slide set with color variations (red/yellow series) for design flexibility.
Related Products
-

Market Value Proof PowerPoint Slide – Line & Bar Chart Dark
#Business Strategy #Market and Competitor Analysis #Graph
-

Segmented Bar Graph and Line Graph – Ideal for Market Analysis
#Market and Competitor Analysis #Graph #Market Analysis
-

Annual Momentum Record – Visualization of Achievements
#Business Strategy #Market and Competitor Analysis #Graph
-

Competitor Analysis Broken Line Graph – Visualizing Market Trends
#Market and Competitor Analysis #Diagram #Graph
