Market Status Analysis & Dot Positioning Map – Understanding Market and Competitors
RM0200004_13
- Last Update 02/01/2025
- File Size 0.2MB
- # of Slides 2
- File Format PPTX
- Slide Ratio 16:9
- Color
Keywords
- #Content-Based Slides
- #Design-Based Slides
- #Market and Competitor Analysis
- #Marketing Plan and Strategy
- #Graph
- #Other
- #Market Analysis
- #Positioning
- #Line
- #Line Chart
- #16:9
- #line chart PowerPoint
- #bubble chart template
- #market analysis slide
- #competitive positioning PPT
- #scatter plot diagram
- #market trend analysis presentation
- #how to create line chart in PowerPoint
About the Product
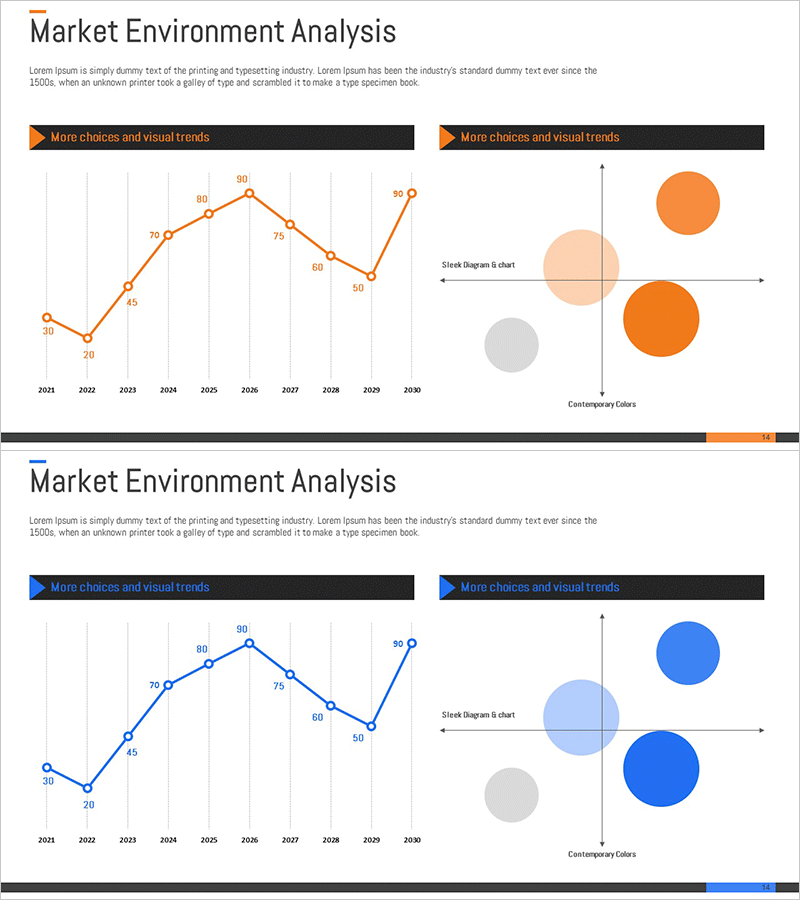
A comprehensive 2-slide PowerPoint set for market environment analysis and competitive positioning. The first slide features a line chart tracking market trends from 2021 to 2030 with 10 data points, clearly visualizing growth, decline, and recovery patterns over time. The second slide presents a bubble chart (scatter plot) mapping competitor positions using X-axis (market size), Y-axis (growth rate), and bubble diameter (market share) to illustrate competitive landscape intuitively. Unified in warm orange tones, both slides are ready for immediate use in marketing and strategy presentations. The 16:9 widescreen format ensures compatibility with modern presentation environments and professional display standards.
Usage Points
-
Main Usage
Designed to visualize market environment analysis and competitive positioning mapping. The line chart expresses market size changes over time with trend visualization, while the bubble chart displays competitor positions using multi-dimensional data to support strategic decision-making.
-
How to Use
Input actual market data into the first slide's line chart to show historical trends and future projections. On the second slide, adjust bubble positions and sizes to compare your company's positioning against competitors. All values and legends are fully editable for customization to your industry and market context.
-
Recommended For
Ideal for marketing strategy development, business plans, investor pitch decks, executive reports, market research presentations, and new business planning meetings. Recommended for marketing managers, executives, consultants, and analysts who need to communicate market conditions and competitive dynamics persuasively.
-
Slide Structure
Slide 1: Line chart with 10 data points (2021–2030), vertical and horizontal gridlines, legend included. Slide 2: Scatter plot with 3 bubbles positioned on X-axis (market size) and Y-axis (growth rate), axis labels, and background quadrant dividers. Both slides feature warm orange accent colors throughout.
Related Products
-

Market Environment Analysis Graph – Deriving Competitive Advantage and Strategy
#Market and Competitor Analysis #Marketing Plan and Strategy #Graph
-

Market Environment Analysis with Line Graph and Positioning Map
#Market and Competitor Analysis #Marketing Plan and Strategy #Graph
-

Positioning Area Graph – Essential Slide for Market Analysis
#Market and Competitor Analysis #Marketing Plan and Strategy #Diagram
-

Positioning Analysis Chart – Market Competitiveness Strategy
#Market and Competitor Analysis #Marketing Plan and Strategy #Diagram
