Market Environment Analysis Graph – Deriving Competitive Advantage and Strategy
RM0200002_13
- Last Update 02/01/2025
- File Size 0.6MB
- # of Slides 2
- File Format PPTX
- Slide Ratio 16:9
- Color
Keywords
- #Content-Based Slides
- #Design-Based Slides
- #Market and Competitor Analysis
- #Marketing Plan and Strategy
- #Graph
- #Other
- #Market Analysis
- #Positioning
- #Line
- #Line Chart
- #16:9
- #line chart PowerPoint slide
- #market analysis presentation template
- #trend analysis chart
- #competitive positioning slide
- #bubble chart PPT
- #marketing strategy slide download
About the Product
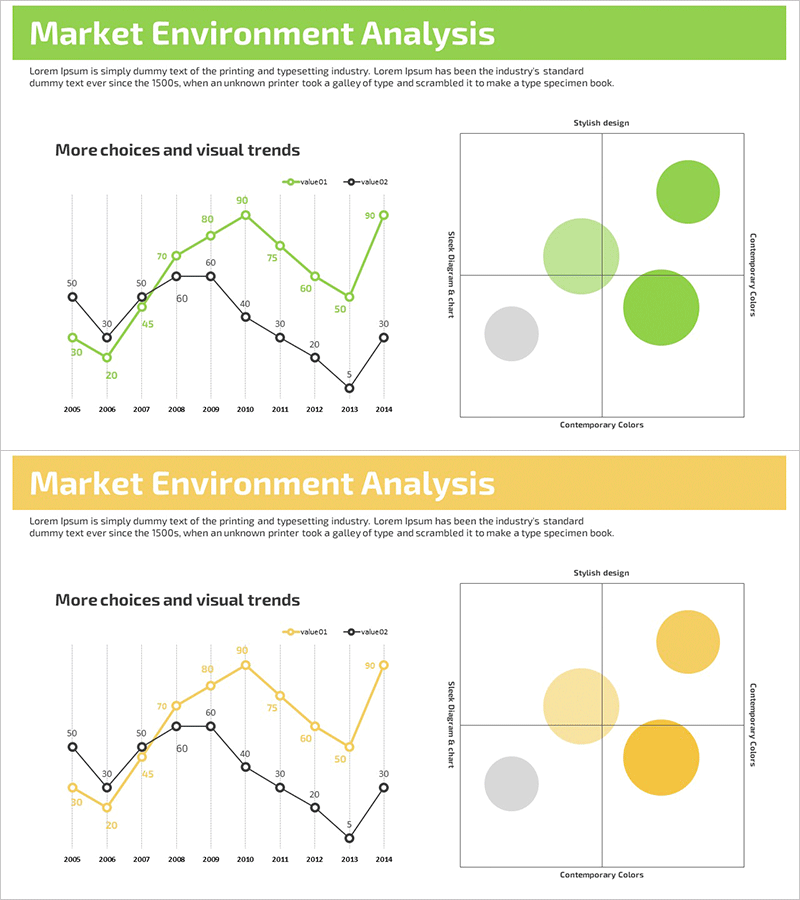
A dual-series line chart PowerPoint slide designed for market environment analysis and competitive positioning. The slide features two data lines (green and black) tracking changes from 2006 to 2014, enabling side-by-side comparison of market indicators. The right side includes a bubble chart (scatter plot) with four quadrants to visualize competitive advantage and strategic positioning. This presentation template is ideal for marketing strategy presentations, business plans, and executive reports where market trend analysis and competitor benchmarking are essential.
Usage Points
-
Main Usage
This slide simultaneously analyzes market trends and competitive positioning. The left line chart tracks two key indicators over time, while the right bubble chart maps current competitive status on a two-dimensional matrix to support strategic decision-making.
-
How to Use
Insert this slide into marketing strategy presentations, business plans, or executive briefings in the market analysis section. Replace the sample data in the line chart with actual figures and adjust bubble sizes and positions on the scatter plot to represent competitive intensity and market opportunities.
-
Recommended For
Marketing managers, strategic planning teams, business analysts, management consultants, and executives presenting market analysis findings. Particularly effective for presentations requiring competitive advantage analysis and market positioning strategy.
-
Slide Structure
Left side: dual-series line chart (2006–2014, green and black lines with data labels). Right side: four-quadrant bubble chart with three circles (green and gray) and axis labels (Competitive Intensity, Market Opportunity). Total 2 slides in 16:9 format.
Related Products
-

Market Environment Analysis with Line Graph and Positioning Map
#Market and Competitor Analysis #Marketing Plan and Strategy #Graph
-

Market Status Analysis & Dot Positioning Map – Understanding Market and Competitors
#Market and Competitor Analysis #Marketing Plan and Strategy #Graph
-

Clothing Market Positioning Map – Strategic Analysis
#Market and Competitor Analysis #Marketing Plan and Strategy #Diagram
-

Competitive Market Positioning Analysis Slide
#Market and Competitor Analysis #Marketing Plan and Strategy #Graph
