Market Value Proof PowerPoint Slide – Line & Bar Chart Dark
RJ0600114_3
- Last Update 06/04/2026
- File Size 14.3MB
- # of Slides 2
- File Format PPTX
- Slide Ratio 16:9
- Color
Keywords
- #Design-Based Slides
- #Business Strategy
- #Market and Competitor Analysis
- #Graph
- #Achievements
- #Market Analysis
- #Column
- #Line
- #Grouped Column
- #Line Chart
- #16:9
- #market performance PowerPoint slide
- #travel satisfaction line chart presentation
- #grouped bar chart market analysis slide
- #dark background data visualization PowerPoint
- #service value proof slide deck
About the Product
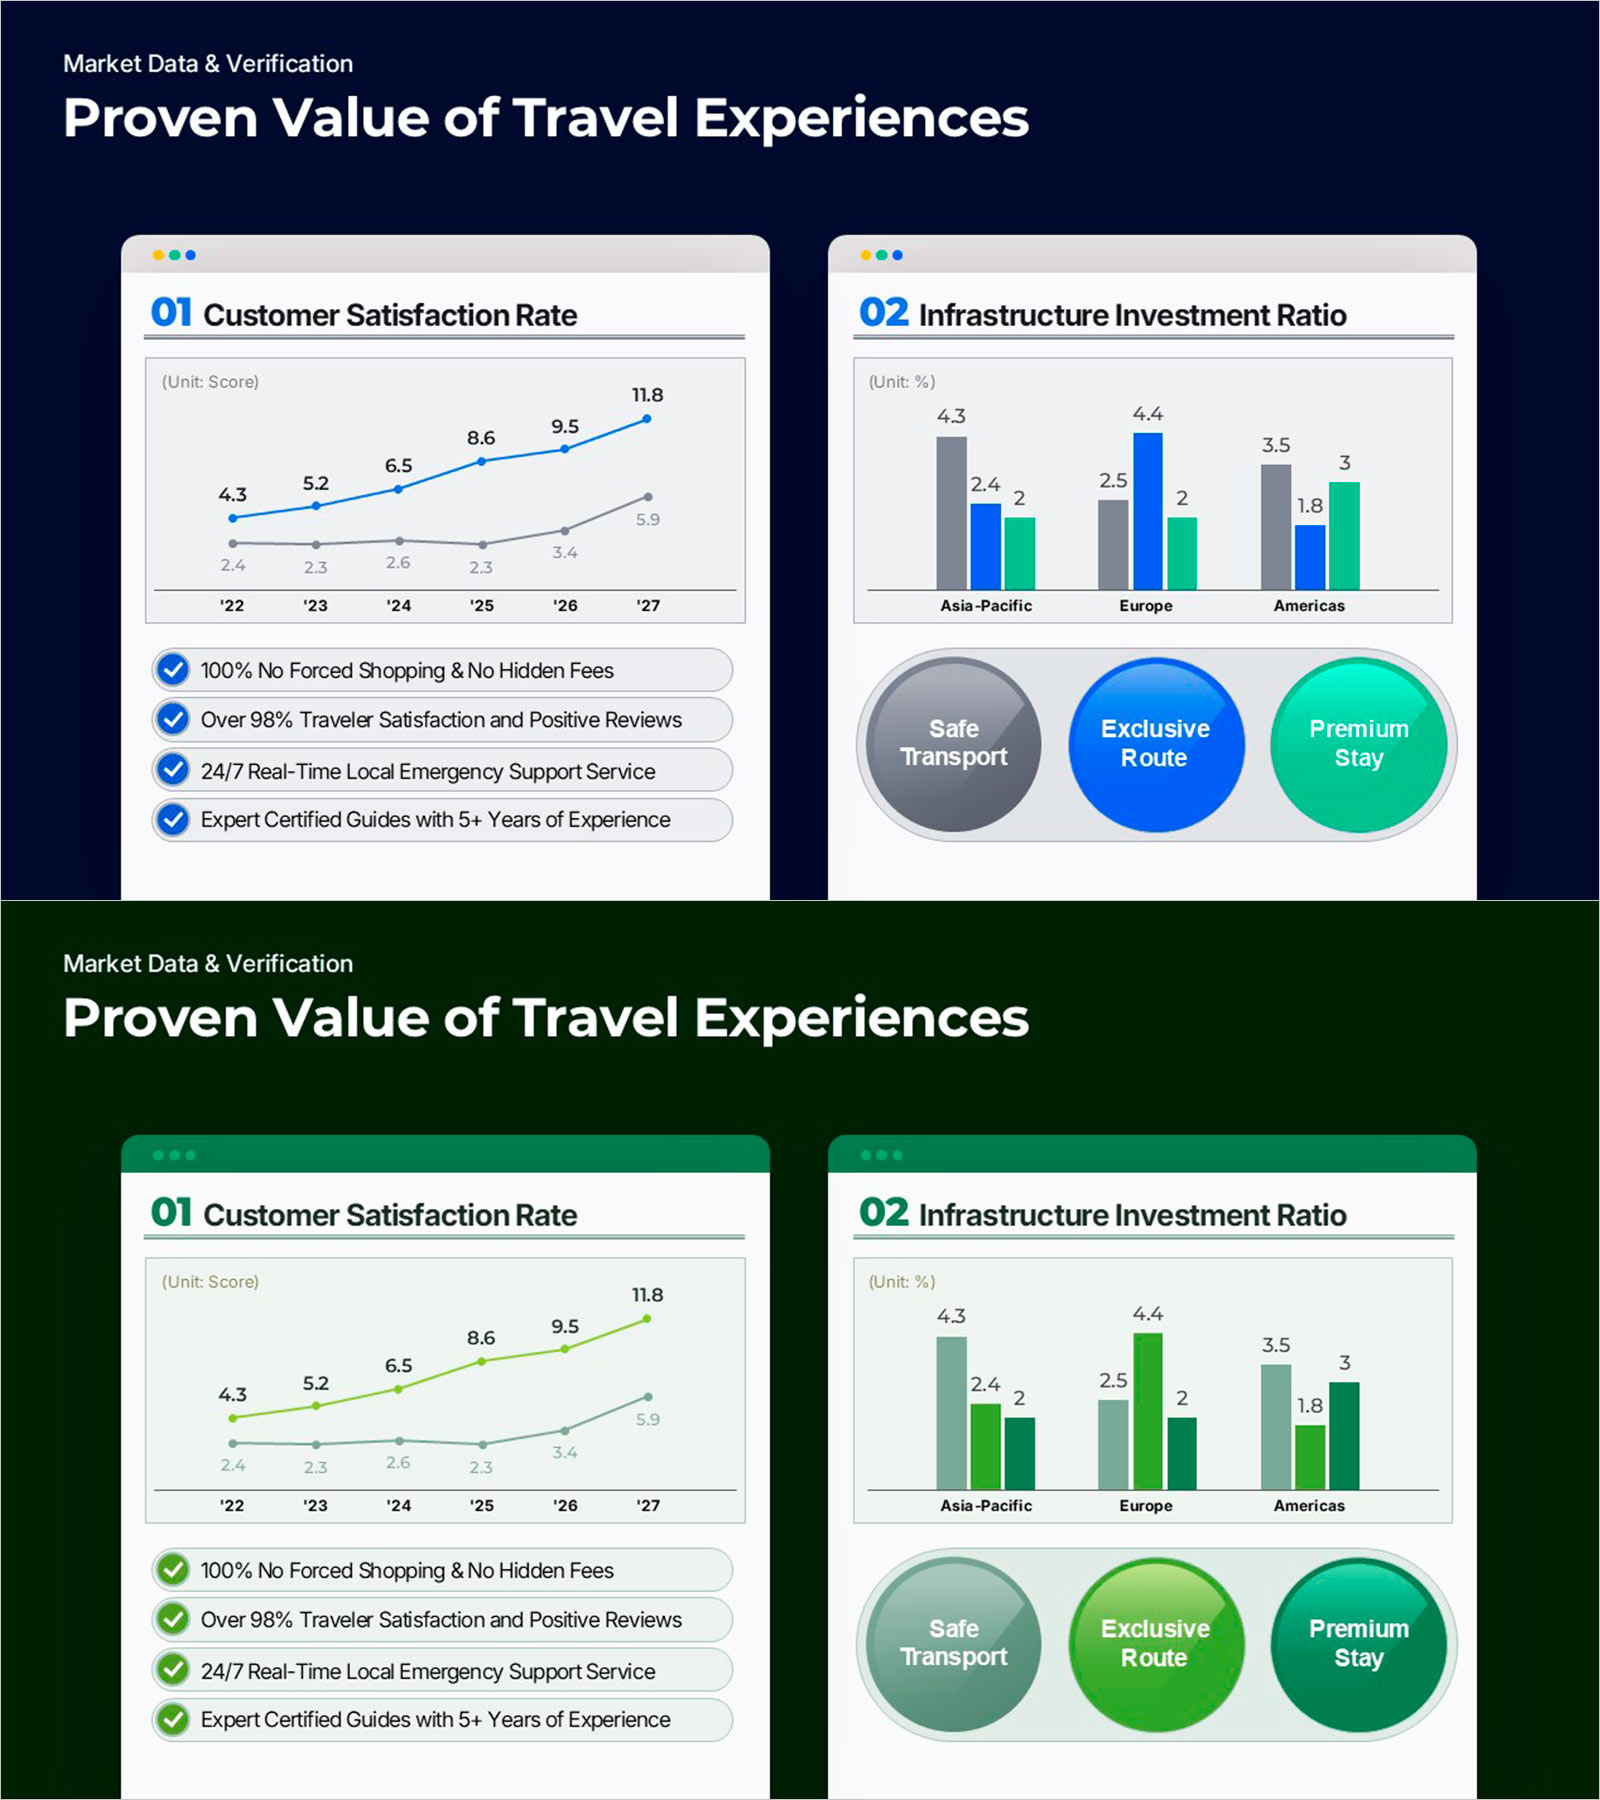
A PowerPoint slide proving travel service value in a two-panel dark layout. The left panel shows a line chart of customer satisfaction scores ('22–'27) with four checkmarked service highlights. The right panel features a grouped bar chart of infrastructure investment ratios across Asia-Pacific, Europe, and America, plus three circular badge icons. Available in green-only and blue-green accent versions to match your presentation theme. Fully editable in PPTX — update chart data, labels, regional figures, and accent colors to fit your business.
Usage Points
-
Main Usage
Shows proven travel service value to investors and partners through customer satisfaction trends and regional infrastructure investment data, all in one slide.
-
How to Use
Update the line chart with your satisfaction scores by year, swap the bar chart regional figures, and edit the checklist items and badge labels to reflect your service strengths.
-
Recommended For
Ideal for travel agency sales teams, tour product managers, and founders who need to prove service quality and growth to investors, partners, or enterprise clients.
-
Slide Structure
One slide, dark background with two white card panels. Left: line chart ('22–'27) and four checkmarks. Right: grouped bar chart and three badge icons. Two accent versions.
Related Products
-

Market Analysis Graph for Business Success
#Business Strategy #Market and Competitor Analysis #Graph
-

Line Graph and Clustered Column Graph – Essential for Competitor Analysis
#Market and Competitor Analysis #Graph #Competitor Analysis
-

Project Market Environment Analysis Chart – Powerful Competitive Strategy
#Market and Competitor Analysis #Graph #Competitor Analysis
-

Comparative Chart Analysis – Optimized for Market and Competitive Analysis
#Market and Competitor Analysis #Graph #Market Analysis
