Trade Market Analysis Graph – Visualizing Market Status
RJ0300017_6
- Last Update 04/22/2025
- File Size 1.1MB
- # of Slides 2
- File Format PPTX
- Slide Ratio 16:9
- Color
Keywords
- #Content-Based Slides
- #Design-Based Slides
- #Market and Competitor Analysis
- #Graph
- #Market Status
- #Market Analysis
- #Horizontal Bar
- #Segmented Horizontal Bar
- #16:9
- #horizontal bar chart PowerPoint
- #bar graph slide template
- #market analysis chart
- #data comparison slide
- #how to create bar chart in PowerPoint
About the Product
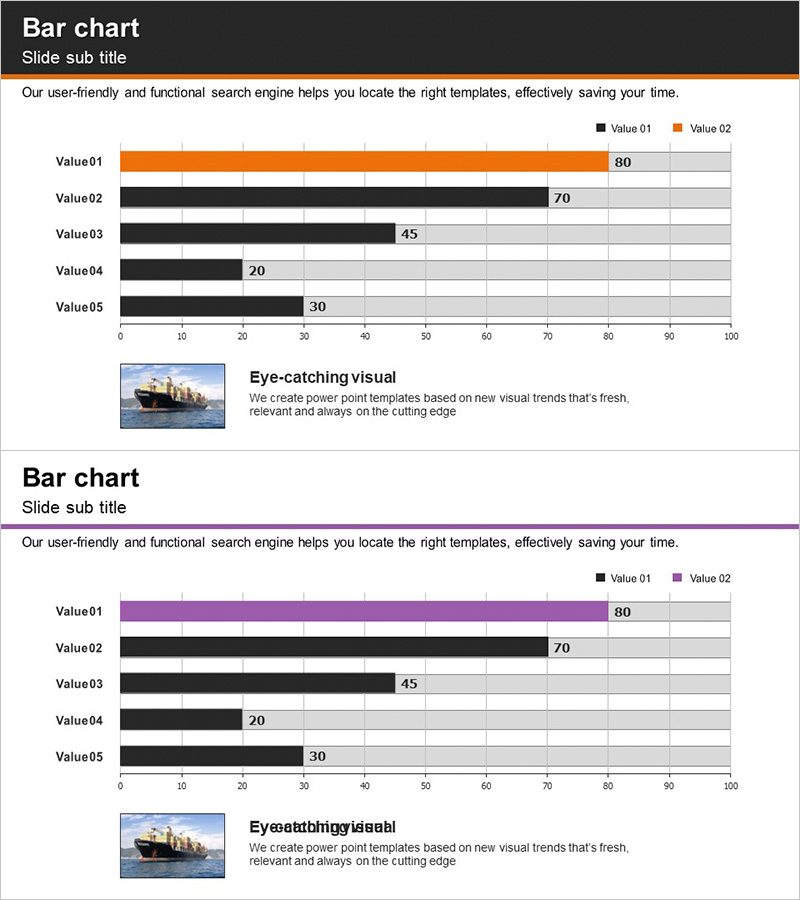
A horizontal bar chart PowerPoint slide optimized for trade market analysis and market status visualization. Featuring a two-tone color scheme of orange and black, this slide enables intuitive comparison of five data values (Value01 through Value05) on a 0–100 normalized scale. Each bar displays its corresponding numerical value clearly, making it immediately ready for presentation use. Composed of 2 slides in 16:9 widescreen format, this template is ideal for market analysis, sales performance reporting, departmental comparisons, and various business data representations.
Usage Points
-
Main Usage
Displays five data points in horizontal bar format to enable immediate visual comparison of relative magnitudes. The orange accent color highlights the top-performing item, drawing audience attention to key data. Ideal for presenting market conditions, sales results, departmental performance, and competitive benchmarking.
-
How to Use
Replace the bar lengths and numerical values with your own data for immediate use. Insert into the market analysis, performance reporting, or business overview sections of your presentation to provide quantitative evidence to your audience. Colors and values are fully customizable through PowerPoint's built-in chart editing tools.
-
Recommended For
Marketing managers, sales directors, executives, management consultants, and trade professionals who need to support decision-making with quantitative data. Suitable for quarterly performance reports, market research presentations, competitive analysis materials, and investor briefings.
-
Slide Structure
Two-slide set with identical 5-item horizontal bar chart layouts. The first slide features orange accent highlighting, while the second offers purple accent variation, allowing adaptation to different presentation contexts. Numerical values displayed to the right of each bar ensure precise data communication and professional appearance.
Related Products
-

Segmented Horizontal Bar Graph for Market Overview – Five Color Template
#Market and Competitor Analysis #Graph #Market Status
-

Pie Chart & Bar Graph for Market Analysis – Visualizing Data
#Market and Competitor Analysis #Graph #Market Status
-

Market Entry Potential and Expansion Strategy Chart
#Market and Competitor Analysis #Graph #Market Status
-

Development Analysis Donut Graph – Visual Data Presentation
#Product/Service Introduction #Market and Competitor Analysis #Graph
