Mint Green Mixed Graph – Market Status Analysis
RJ0900003_24
- Last Update 08/16/2025
- File Size 0.1MB
- # of Slides 2
- File Format PPTX
- Slide Ratio 16:9
- Color
Keywords
About the Product
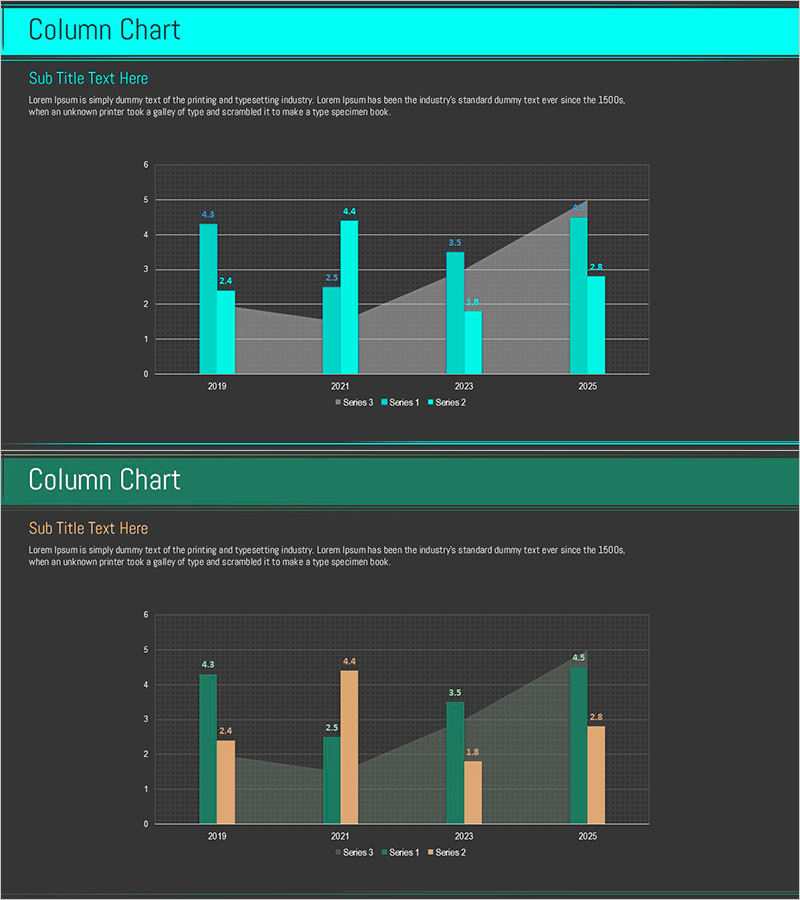
A mixed-type graph PowerPoint slide designed for market status analysis presentations. The mint green background combines column charts and line graphs to display three data series simultaneously, enabling both trend comparison and numerical visualization. Data from 2019 to 2025 is represented across four years with values ranging from 4.3 to 1.8, making it ideal for company profiles, business plans, and investor pitch decks where market size, growth rates, and competitive comparisons need explanation. Provided in 16:9 widescreen PPTX format with fully editable text, numerical values, and legend elements for seamless customization.
Usage Points
-
Main Usage
Visualizes multiple datasets—market trends, growth rates, and competitive comparisons—on a single slide to establish clear decision-making foundations. Column charts emphasize absolute values while line graphs highlight trends, enhancing audience comprehension and engagement.
-
How to Use
Deploy in investor presentations, business plan documents, and market analysis reports within the market overview section. Input your existing data into the embedded chart, which automatically visualizes the information. Customize legend labels, axis titles, and headers to align with your specific dataset and messaging.
-
Recommended For
Recommended for presentations to executives, investors, and business partners when explaining market size, growth trajectories, and market share evolution. Particularly effective when comparing three or more entities—such as your company, competitors, and market averages—simultaneously.
-
Slide Structure
Comprises a title and subtitle input area at the top, a central mixed-type chart (3-series columns plus 1-series line) in the middle, and a legend with data source field at the bottom. Both slides share identical layouts, enabling consistent presentation of multiple markets or time periods in unified formatting.
Related Products
-

Sales and Cost Area Graphs – Market Analysis Visualization
#Market and Competitor Analysis #Graph #Other
-

Residential Lighting Graph – Market Analysis
#Market and Competitor Analysis #Graph #Other
-

Green-Blue Regional Chart Analysis – Market Status and Competitor Analysis
#Market and Competitor Analysis #Graph #Other
-

Market Analysis with Area Charts
#Market and Competitor Analysis #Graph #Other
