Market Analysis Area Graph – Effective Data Visualization
RJ0300017_16
- Last Update 04/22/2025
- File Size 0.2MB
- # of Slides 2
- File Format PPTX
- Slide Ratio 16:9
- Color
Keywords
About the Product
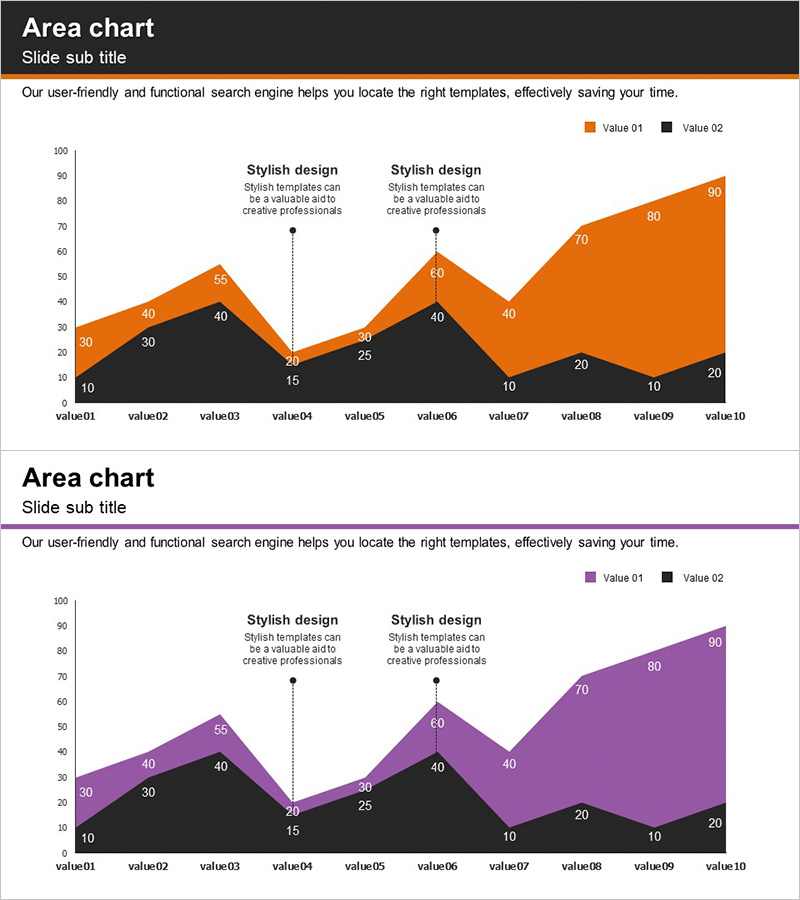
A 2-slide area chart PowerPoint template optimized for market analysis and operational planning presentations. The area chart features two data series in orange and black, visualizing changes in trends and cumulative proportions over time across 10 data points ranging from 10 to 90. Annotation areas at midpoint allow you to highlight key insights and findings. Delivered in 16:9 widescreen PPTX format for immediate editing, this slide design is ideal for competitive analysis, risk management, market trend comparisons, and business performance reviews. Each series can be customized with your own data labels and values.
Usage Points
-
Main Usage
Displays two data series simultaneously, showing both individual trends and cumulative proportions over time. Ideal for comparing company performance vs. competitors in market analysis, actual vs. projected figures in operational planning, and risk level changes in risk management scenarios.
-
How to Use
Insert into the analysis or results section of your presentation to support data-driven decision-making. Assign the orange area to represent primary metrics and the black area for comparison targets. Add key findings in the annotation box at the midpoint. Click on data labels to update with your actual figures, and the chart automatically recalculates.
-
Recommended For
Recommended for executives, planners, and analysts preparing executive reports, business plan presentations, marketing strategy documents, and financial analysis materials. Particularly effective for quarterly and annual performance comparisons, market share evolution, customer satisfaction trends, and time-series data analysis.
-
Slide Structure
2-slide set featuring an orange and black 2-series area chart on the first slide (10 data points, range 10–90) and a purple and black 2-series area chart on the second slide. Both slides include title, subtitle, description text areas, and midpoint annotation boxes. Optimized for 16:9 widescreen format to fit modern presentation environments.
Related Products
-

Market Analysis Area Graph – Modern Design
#Operational Plan #Market and Competitor Analysis #Graph
-

Gradient Theme Area Diagram – Market and Competitor Analysis
#Market and Competitor Analysis #Diagram #Graph
-

Sales and Profit Chart by Year – Effective Financial Analysis
#Market and Competitor Analysis #Financial Plans and Performance #Diagram
-

Visualize Market Trends and Cash Flow with Area Charts!
#Market and Competitor Analysis #Financial Plans and Performance #Graph
