Market Analysis Area Graph – Modern Design
RJ0300013_7
- Last Update 04/21/2025
- File Size 3MB
- # of Slides 2
- File Format PPTX
- Slide Ratio 16:9
- Color
Keywords
- #Content-Based Slides
- #Design-Based Slides
- #Operational Plan
- #Market and Competitor Analysis
- #Graph
- #Risk Management
- #Market Analysis
- #Other
- #Area Chart
- #16:9
- #area chart PowerPoint
- #two-series area graph slide
- #data visualization template
- #market analysis chart
- #sales trend presentation
- #how to create area chart in PowerPoint
About the Product
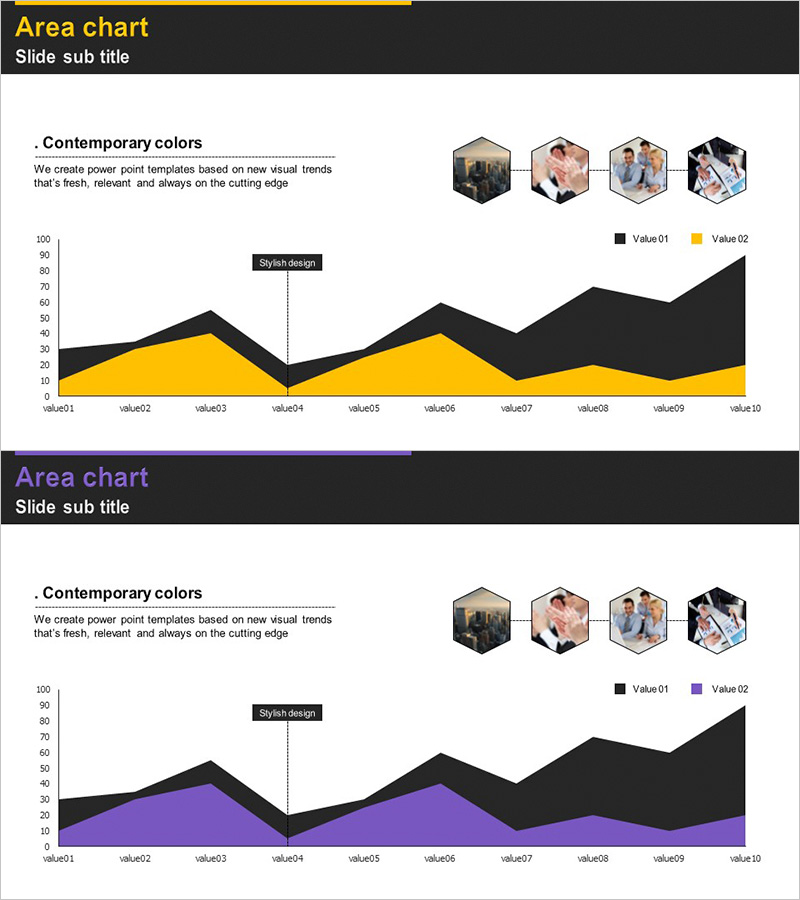
A two-series area chart PowerPoint slide designed for market analysis, sales trends, and performance comparisons across time periods. This presentation template features two color variations—black with yellow and black with purple—displaying 10 data points along a continuous timeline. Includes hexagonal image elements, legend, and annotation features for immediate customization. Delivered in 16:9 widescreen format with 2 slides, ready for editing and integration into business presentations.
Usage Points
-
Main Usage
Visualizes cumulative changes across two or more data series over time. Perfect for displaying market share evolution, sales revenue comparison, customer segment growth rates, departmental performance accumulation, and any presentation requiring stacked area representation.
-
How to Use
Select the color version that matches your presentation theme—either black with yellow or black with purple. Edit the legend and data labels to reflect your actual metrics. Replace the 10 data points with your real figures. Use the annotation box to highlight key turning points or significant changes in the data.
-
Recommended For
Executive reports, business performance presentations, marketing analysis materials, financial results briefings, and market research findings. Particularly effective for executive-level presentations emphasizing cumulative trends and quarterly or annual performance reviews.
-
Slide Structure
Each slide contains a title area, descriptive text, a two-series stacked area chart, legend with Value 01 and Value 02, and data labels. The chart spans from 0 to 100 on the Y-axis and value01 through value10 on the X-axis, with two series rendered as cumulative areas. Four hexagonal image placeholders and a 'Stylish design' annotation appear at the top.
Related Products
-

Market Analysis Area Graph – Effective Data Visualization
#Operational Plan #Market and Competitor Analysis #Graph
-

Orange Hexagon Presentation Template Area Chart
#Business Strategy #Market and Competitor Analysis #Graph
-

Hologram Wide PowerPoint Area Chart – Embodying Contemporary Sensibility
#Operational Plan #Financial Plans and Performance #Graph
-

Modern Blue Presentation Area Chart - Optimized for Market Analysis
#Market and Competitor Analysis #Graph #Other
