Hologram Wide PowerPoint Area Chart – Embodying Contemporary Sensibility
RJ0200053_15
- Last Update 04/13/2025
- File Size 0.6MB
- # of Slides 2
- File Format PPTX
- Slide Ratio 16:9
- Color
Keywords
- #Content-Based Slides
- #Design-Based Slides
- #Operational Plan
- #Financial Plans and Performance
- #Graph
- #Other
- #Risk Management
- #Sales and Revenue
- #Other
- #Area Chart
- #16:9
- #area chart PowerPoint
- #area graph slide template
- #data visualization PowerPoint
- #trend analysis chart
- #financial report slide
- #operational metrics presentation
About the Product
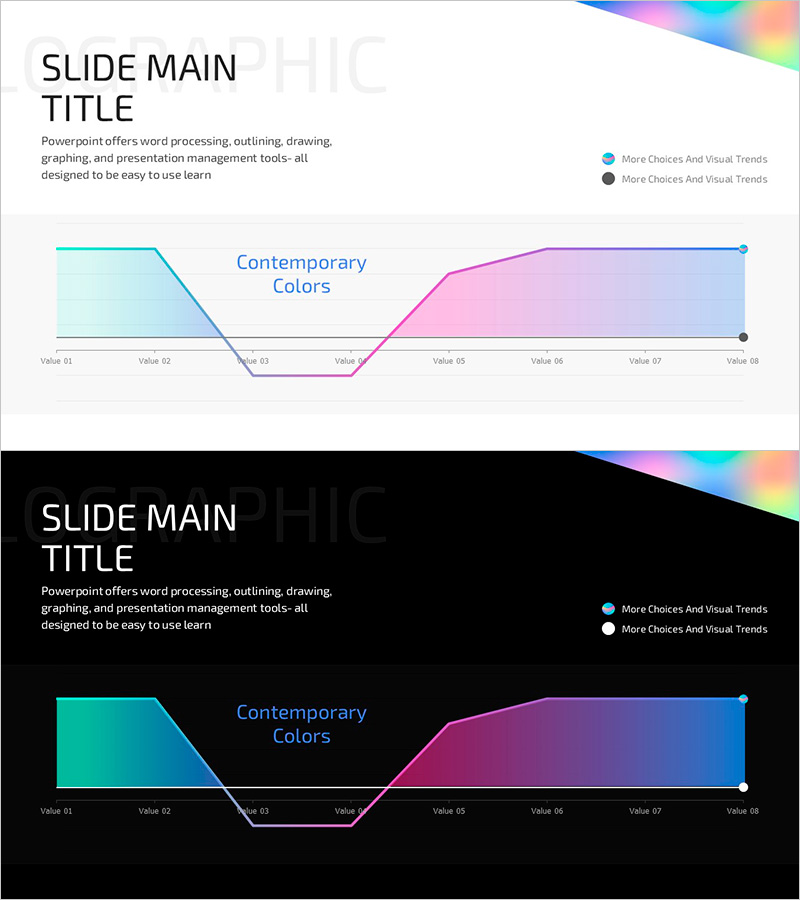
An area chart PowerPoint slide that visualizes 8 data points across a timeline with a gradient fill transitioning from cyan to purple. The rainbow-colored accent line at the top adds contemporary visual appeal, while the filled area beneath clearly shows data trends and cumulative values. Includes both light and dark theme versions on 2 slides, allowing you to match your presentation environment. Perfect for financial reports, sales trend analysis, operational metrics, and performance dashboards in business presentations.
Usage Points
-
Main Usage
Displays time-series data changes using filled area visualization, allowing simultaneous comparison of cumulative totals and individual data series. Commonly used for financial performance tracking, sales trend analysis, operational KPI monitoring, and market share evolution in business presentations.
-
How to Use
Enter your actual values into the 8 data points (Value 01–08) labeled on the slide, and the area height adjusts automatically. Customize the legend items (blue and pink series names) to match your data categories, and update the category labels as needed. Use the light theme for bright presentation environments and the dark theme for low-light settings.
-
Recommended For
Finance teams presenting quarterly revenue and expense trends, marketing teams analyzing campaign performance, operations teams reporting KPI status, executive leadership presenting business performance, and investor presentations demonstrating growth trajectories.
-
Slide Structure
2-slide set: light theme (white background) and dark theme (black background). Each slide features an 8-point area chart with gradient fill, rainbow accent line at top, legend with blue/pink/black indicators, left-side text area, and 16:9 widescreen format optimization.
Related Products
-

Area Chart for Market Trend Analysis – Insights and Growth
#Market and Competitor Analysis #Financial Plans and Performance #Graph
-

Three-Dimensional Graph Analysis – Market and Competitor Analysis Slide
#Product/Service Introduction #Market and Competitor Analysis #Marketing Plan and Strategy
-

Coffee Consumption Survey by Gender – Visual Data Infographic
#Market and Competitor Analysis #Financial Plans and Performance #Diagram
-

Business Sales and Profit Statement – Profit and Loss Visualization
#Financial Plans and Performance #Diagram #Other
