Visualize Market Trends and Cash Flow with Area Charts!
RJ0300031_15
- Last Update 04/26/2025
- File Size 0.7MB
- # of Slides 2
- File Format PPTX
- Slide Ratio 16:9
- Color
Keywords
- #Content-Based Slides
- #Design-Based Slides
- #Market and Competitor Analysis
- #Financial Plans and Performance
- #Graph
- #Market Analysis
- #Cash Flow Statement
- #Table
- #Other
- #Standard Table
- #Area Chart
- #16:9
- #area chart PowerPoint slide
- #area graph template
- #trend data visualization
- #cash flow chart
- #market analysis PowerPoint
- #how to create area chart in PowerPoint
About the Product
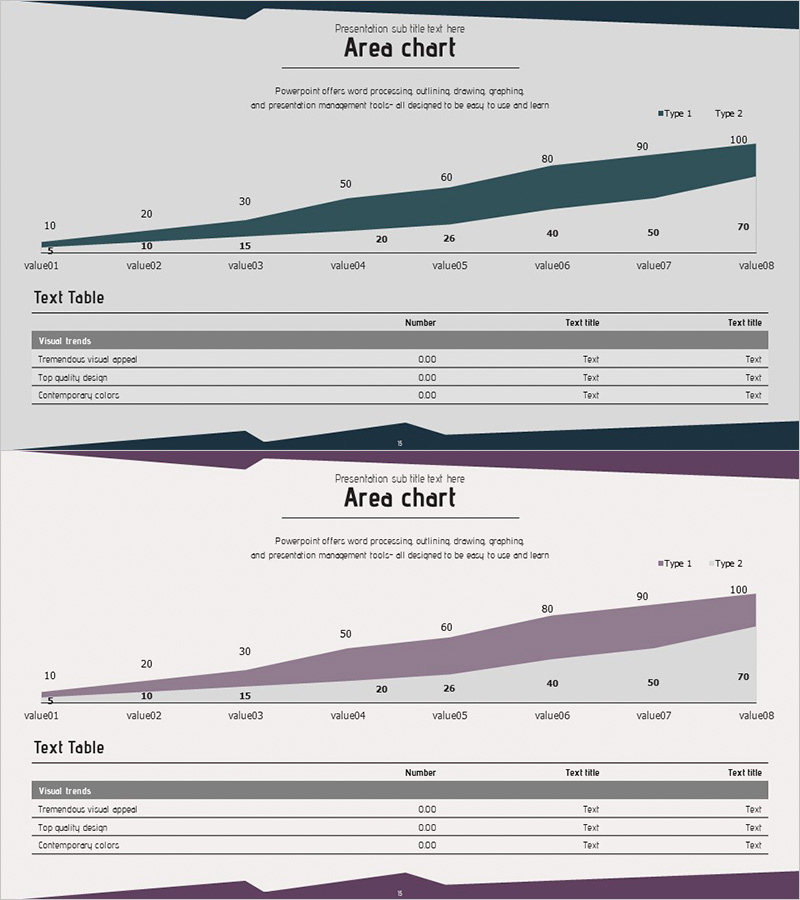
Visualize market trends and cash flow dynamics with this area chart PowerPoint slide template. The design features 8 sequential data points ranging from 10 to 100, rendered in teal and purple gradient fills that intuitively convey change over time. Paired with a supporting text table below, this slide combines visual and numerical data representation for comprehensive analysis. Ready to use in financial reports, business analysis presentations, marketing performance reviews, and investor pitch decks.
Usage Points
-
Main Usage
Display cumulative trends over time—revenue growth, cost evolution, market share changes, or cash flow patterns—using stacked area fills. Multiple data series overlap to show both total magnitude and individual component proportions simultaneously, enabling quick pattern recognition.
-
How to Use
Insert into financial reports (revenue and expense trends), business plans (market growth forecasts), marketing presentations (customer acquisition curves), and investor pitches (business performance metrics). The accompanying text table reinforces numerical accuracy and supports data-driven storytelling.
-
Recommended For
Finance professionals, marketing strategists, business analysts, and executives presenting quarterly or annual performance data. Ideal for competitive benchmarking, business expansion planning, and stakeholder reporting where trend visualization is critical.
-
Slide Structure
Title section at top, central area chart with 8 data points in teal-to-purple gradient, supporting text table (3 rows × 4 columns) at bottom. Two slide variations with color swaps (teal/purple) allow flexible sequencing in multi-slide presentations.
Related Products
-

Competitor Analysis Graphs & Tables – Delivering Market Insights
#Market and Competitor Analysis #Diagram #Graph
-

Gradient Theme Area Diagram – Market and Competitor Analysis
#Market and Competitor Analysis #Diagram #Graph
-

Sales and Profit Chart by Year – Effective Financial Analysis
#Market and Competitor Analysis #Financial Plans and Performance #Diagram
-

Type Comparison Analysis Graph & Table – Effective Tool for Market Analysis
#Market and Competitor Analysis #Diagram #Graph
