Trade Business Analysis Graph – Visualizing Market Status
RJ0300017_11
- Last Update 04/22/2025
- File Size 2.8MB
- # of Slides 2
- File Format PPTX
- Slide Ratio 16:9
- Color
Keywords
- #Content-Based Slides
- #Design-Based Slides
- #Market and Competitor Analysis
- #Graph
- #Market Status
- #Market Analysis
- #Column
- #Segmented Column
- #16:9
- #vertical stacked bar chart PowerPoint
- #4-item comparison slide
- #trade market analysis template
- #business data visualization
- #how to create stacked bar chart in PowerPoint
About the Product
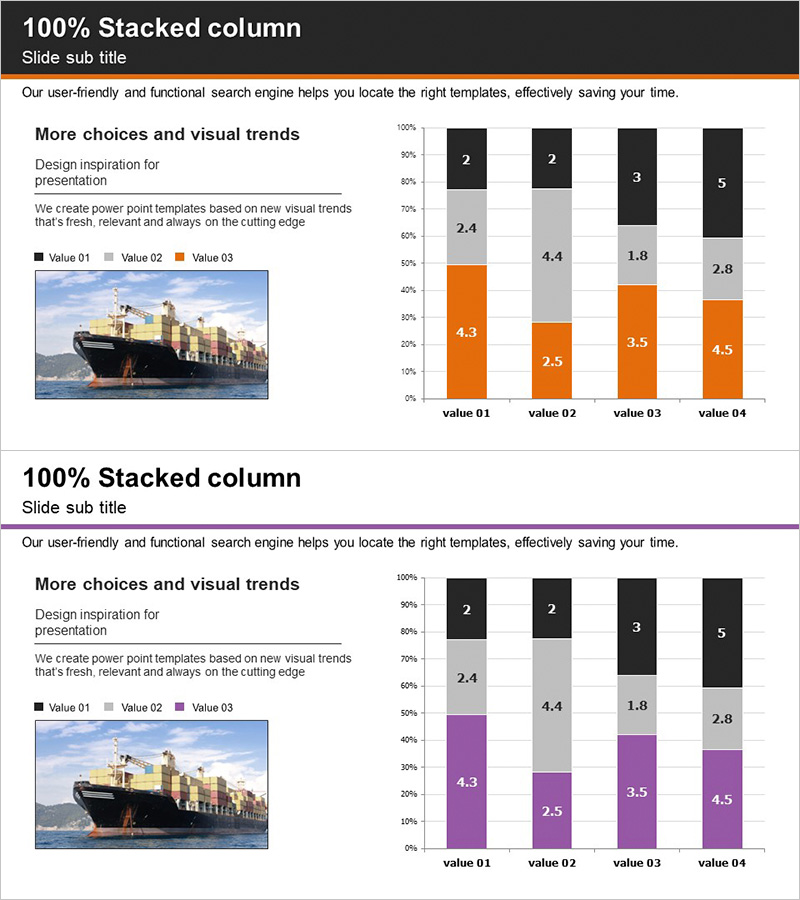
A vertical stacked bar chart PowerPoint slide optimized for trade business analysis and market status visualization. Designed to clearly compare numerical data across four items using a three-series stacked format with black, gray, and accent colors (orange or purple). Each bar is normalized to 100% baseline, enabling intuitive understanding of proportional relationships and absolute values simultaneously. This 2-slide set is ready for immediate use in presentations and reports, ideal for market trends, competitive analysis, sales performance, and business data visualization in trade and export-import contexts.
Usage Points
-
Main Usage
Compares trade and export-import market conditions and sales performance across four items using a stacked bar format. The three-series color scheme (black, gray, accent) simultaneously displays compositional ratios and absolute values, making it highly effective for executive briefings and investor presentations.
-
How to Use
Replace the displayed numerical values with your actual data for immediate use. Adjust bar heights and color segments to create comparative analysis by quarter, region, or product category. Modify legend labels and axis titles to customize for various business contexts and reporting scenarios.
-
Recommended For
Ideal for trade companies, export-import managers, market analysts, and business reporting professionals. Perfect for business plans, quarterly performance reports, investor pitch decks, and marketing strategy presentations—especially in market overview and competitive analysis sections.
-
Slide Structure
2-slide set featuring vertical stacked bar charts with four items (value 01–04) per slide. First slide emphasizes orange accent color; second slide uses purple accent for design variation. Each bar is divided into three segments (black, gray, accent) representing 100% stacked proportions.
Related Products
-

Market Analysis and Status Graph - Harmony of Blue and Orange
#Market and Competitor Analysis #Graph #Market Status
-

3D Vertical Segmentation Graph – Market Analysis
#Market and Competitor Analysis #Graph #Market Status
-

Vertical Bar Segmentation Graph – A Powerful Tool for Market Analysis
#Market and Competitor Analysis #Graph #Market Status
-

Internet Theme Segmentation Bar Graph – Market Status Analysis
#Market and Competitor Analysis #Graph #Market Status
