3D Vertical Segmentation Graph – Market Analysis
RJ0500003_5
- Last Update 06/08/2025
- File Size 5.4MB
- # of Slides 2
- File Format PPTX
- Slide Ratio 16:9
- Color
Keywords
- #Content-Based Slides
- #Design-Based Slides
- #Market and Competitor Analysis
- #Graph
- #Market Status
- #Market Analysis
- #Column
- #Segmented Column
- #16:9
- #3D segmentation graph PowerPoint
- #vertical bar chart template
- #market analysis slide
- #multi-series data comparison
- #how to create segmentation chart in PowerPoint
About the Product
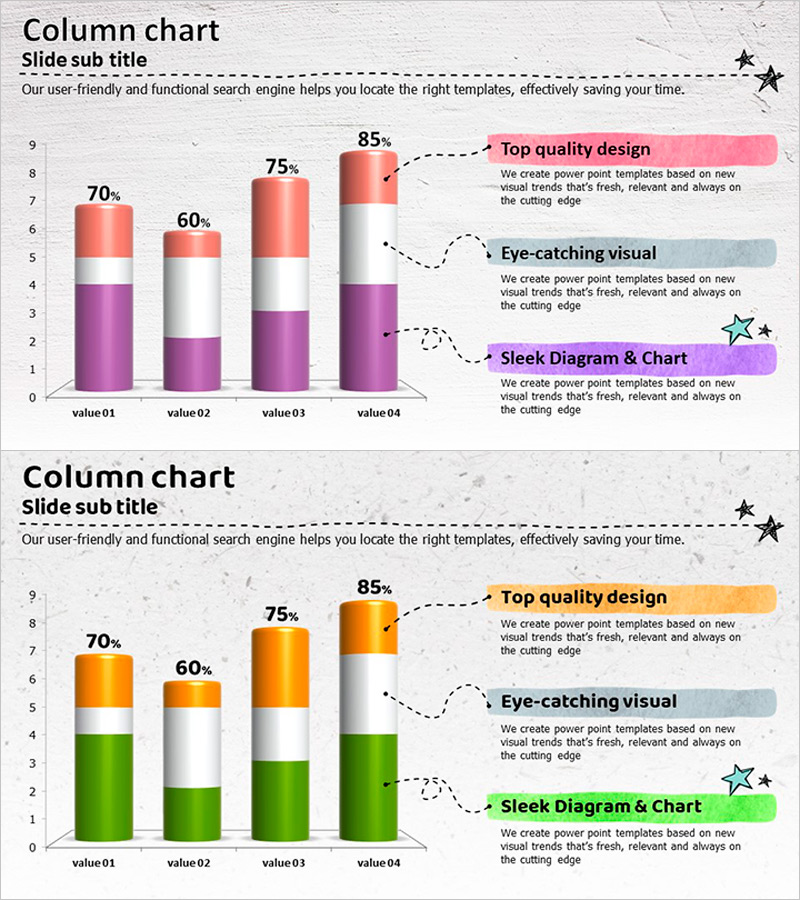
A 3D vertical segmentation graph PowerPoint slide optimized for market analysis and multi-series data comparison. The slide displays four data series as vertical columns with percentage values (70%, 60%, 75%, 85%) labeled at the top of each bar for enhanced clarity. A three-tier color gradient—pink, white, and purple—visualizes the hierarchical data structure, while dashed arrows and text callouts highlight key insights. This presentation slide is ready to use in reports, business proposals, and strategic presentations.
Usage Points
-
Main Usage
Displays multiple data series simultaneously for market analysis, competitive benchmarking, and sales performance comparison. The 3D vertical bar format allows intuitive comparison of numerical differences across categories, while percentage labels clarify relative proportions and relationships.
-
How to Use
Insert this slide into the analysis section of presentations when comparing market size, customer satisfaction scores, or sales volumes. Replace the percentage values with actual data, edit the text callouts to match your presentation context, and adjust colors to align with corporate branding guidelines.
-
Recommended For
Marketing professionals, business analysts, sales managers, and strategy planners presenting market insights, competitive analysis, quarterly performance reports, and investor pitch decks. Ideal for demonstrating data-driven decision-making and market positioning.
-
Slide Structure
Two-slide layout. First slide features four vertical bars in pink-white-purple gradient with percentage labels and three annotated callout boxes (Top quality design, Eye-catching visual, Sleek Diagram & Chart). Second slide repeats the structure with orange-white-green color scheme. 16:9 widescreen format, PPTX file.
Related Products
-

Market Analysis and Status Graph - Harmony of Blue and Orange
#Market and Competitor Analysis #Graph #Market Status
-

Vertical Bar Segmentation Graph – A Powerful Tool for Market Analysis
#Market and Competitor Analysis #Graph #Market Status
-

Blue Pink Market Analysis Segmented Vertical Bar Graph
#Market and Competitor Analysis #Graph #Market Status
-

Internet Theme Segmentation Bar Graph – Market Status Analysis
#Market and Competitor Analysis #Graph #Market Status
