Internet Theme Segmentation Bar Graph – Market Status Analysis
RB0200006_5
- Last Update 03/08/2025
- File Size 0.3MB
- # of Slides 2
- File Format PPTX
- Slide Ratio 4:3
- Color
Keywords
- #Content-Based Slides
- #Design-Based Slides
- #Market and Competitor Analysis
- #Graph
- #Market Status
- #Customer Analysis
- #Market Analysis
- #Column
- #Segmented Column
- #4:3
- #segmented bar chart PowerPoint
- #bar graph presentation slide
- #market analysis chart
- #year-over-year comparison
- #4-item bar graph
- #business data visualization
- #how to create bar chart in PowerPoint
About the Product
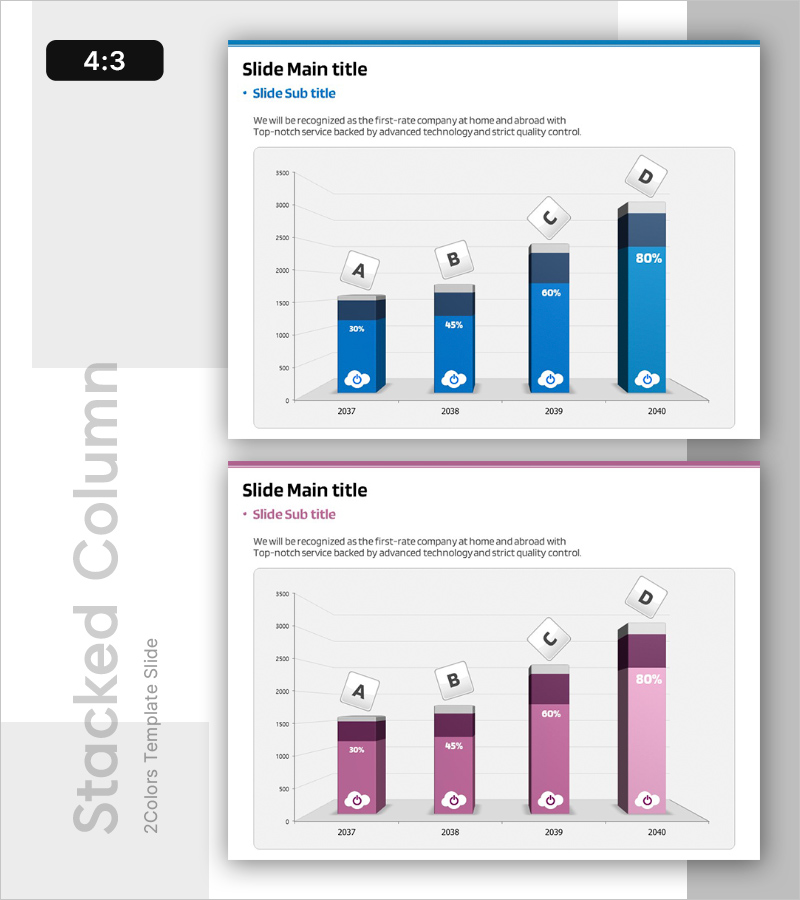
A segmented bar chart PowerPoint slide designed to visualize market status analysis and year-over-year growth trends. This presentation template displays data across four years (2037–2040) divided into four items (A, B, C, D), with each bar showing both percentage values at the top and absolute figures at the bottom for dual-layer information delivery. Two color versions—blue and pink—are included, allowing you to select the palette that best matches your presentation theme and brand identity. The 4:3 aspect ratio, 2-slide format enables immediate editing and deployment in business presentations.
Usage Points
-
Main Usage
This segmented bar chart is optimized for comparing numerical values across years and items while highlighting growth trends at a glance. Ideal for market status analysis, sales performance comparison, departmental performance evaluation, competitive benchmarking, and other business data visualization needs requiring clear multi-dimensional comparison.
-
How to Use
Bar colors and heights enable intuitive item-to-item comparison. Dual labeling—percentage at the top and absolute value at the bottom—communicates both relative proportions and actual figures simultaneously. The blue version emphasizes reliability and stability, while the pink version conveys activity and growth momentum, making each suitable for different presentation contexts.
-
Recommended For
Executive reports, quarterly performance reviews, marketing ROI analysis, investor presentations, and business planning sessions. Ideal for executives, managers, marketing teams, and sales professionals who need data-driven decision support and stakeholder communication.
-
Slide Structure
2-slide format: Slide 1 features a blue-toned segmented bar chart (4 years × 4 items = 16 bars); Slide 2 presents identical data in pink tones. Each slide includes title, subtitle, descriptive text areas, legend, and axis labels. The 4:3 aspect ratio ensures compatibility across all standard projector environments.
Related Products
-

100% Stacked Column Chart Slide | Ratio Comparison Data PPT
#Market and Competitor Analysis #Graph #Customer Analysis
-

Market Analysis and Status Graph - Harmony of Blue and Orange
#Market and Competitor Analysis #Graph #Market Status
-

Customer Analysis Diagram & Segmentation Graph – In-depth Market Insights
#Market and Competitor Analysis #Graph #Customer Analysis
-

Trade Business Analysis Graph – Visualizing Market Status
#Market and Competitor Analysis #Graph #Market Status
