Blue Pink Market Analysis Segmented Vertical Bar Graph
RJ0400006_5
- Last Update 05/18/2025
- File Size 0.7MB
- # of Slides 2
- File Format PPTX
- Slide Ratio 16:9
- Color
Keywords
About the Product
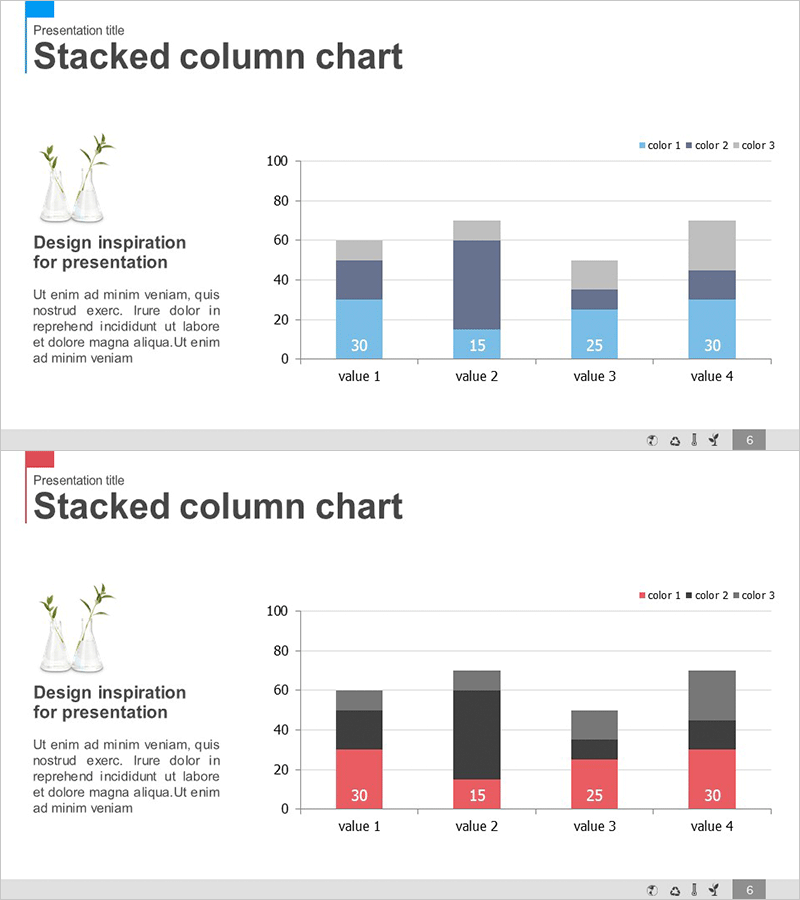
A segmented vertical bar chart PowerPoint slide optimized for market analysis and competitive landscape presentations. The stacked column design features three color series—blue, pink, and gray—enabling clear comparison of multiple data points across four categories. Each bar displays numeric labels for precise data communication, while the left side incorporates a botanical illustration and text area for design context and explanatory content. Delivered as a 2-slide PPTX template in 16:9 widescreen format, fully editable and ready for immediate use.
Usage Points
-
Main Usage
Ideal for market analysis, competitor benchmarking, sales performance tracking, and customer segmentation presentations. The stacked bar structure simultaneously visualizes total volume and individual series proportions, making it highly effective for interpreting complex multi-dimensional datasets.
-
How to Use
Customize the color series (blue, pink, gray) to match your data categories and replace numeric labels with actual values. Update the left-side text area with analysis insights or key findings to integrate visual and narrative communication. Adjust background and chart colors to align with corporate branding guidelines.
-
Recommended For
Recommended for marketing teams presenting market insights, sales teams conducting competitive analysis, executive quarterly performance reviews, and consulting projects requiring data-driven analysis sections. Particularly suited for business presentations comparing 3–4 quantitative data series.
-
Slide Structure
Both slides feature identical layout: left side contains botanical illustration and 'Design inspiration for presentation' text area; right side displays a stacked vertical bar chart with four categories (value 1–4). Each bar comprises three segments—blue (bottom), pink (middle), gray (top)—with numeric labels embedded in the blue segment (30, 15, 25, 30). Legend positioned in upper right corner.
Related Products
-

Vertical Bar Segmentation Graph – A Powerful Tool for Market Analysis
#Market and Competitor Analysis #Graph #Market Status
-

Market Analysis and Status Graph - Harmony of Blue and Orange
#Market and Competitor Analysis #Graph #Market Status
-

Trade Business Analysis Graph – Visualizing Market Status
#Market and Competitor Analysis #Graph #Market Status
-

Internet Theme Segmentation Bar Graph – Market Status Analysis
#Market and Competitor Analysis #Graph #Market Status
