Market Analysis Graph with Office Worker Character – Segmented Design
RJ0300016_8
- Last Update 04/22/2025
- File Size 1.3MB
- # of Slides 2
- File Format PPTX
- Slide Ratio 16:9
- Color
Keywords
About the Product
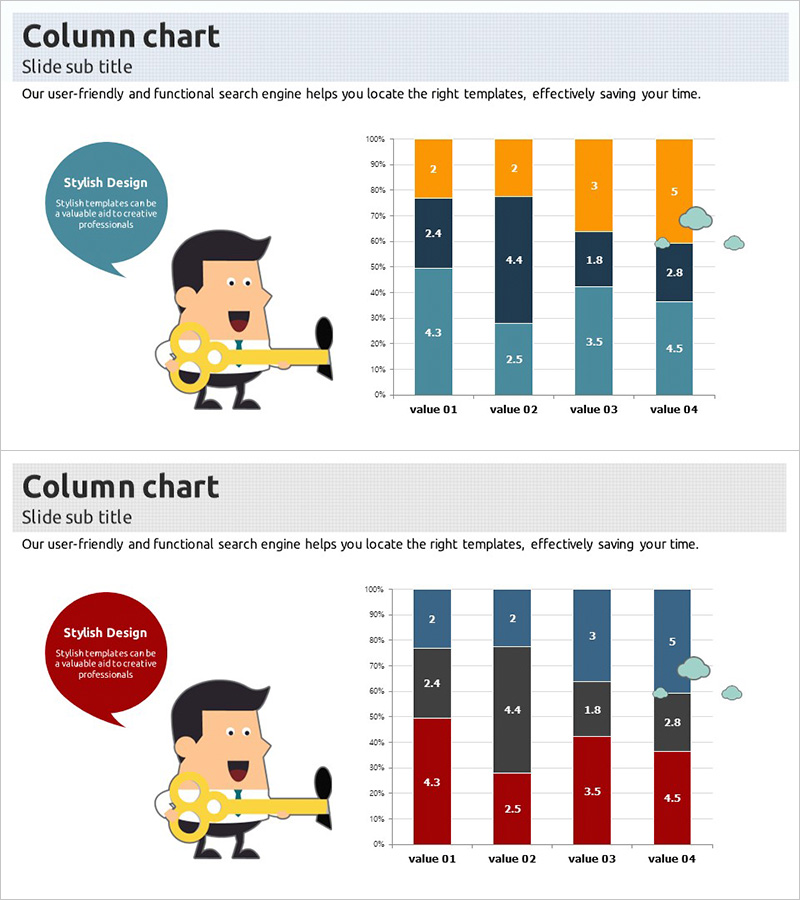
A segmented column chart PowerPoint slide featuring an office worker character for market analysis data visualization. This slide presents 4 items (value 01 to 04) divided into 3-4 data series, enabling simultaneous comparison of values and composition ratios. The design uses teal, black, and orange color coding to clearly differentiate data layers, with numerical labels embedded in each segment. This presentation template is ready to use in reports, business proposals, and strategic presentations where multi-series data comparison is required.
Usage Points
-
Main Usage
This segmented column chart enables simultaneous comparison of multiple data series and composition ratios. It is ideal for market analysis, sales performance, budget allocation, and customer segmentation where multiple metrics must be compared across categories. The teal, black, and orange color scheme clearly distinguishes data layers and improves information hierarchy.
-
How to Use
Use this slide in the market analysis, business performance, or results analysis sections of presentations. The included office worker character adds a professional yet approachable tone to business presentations, while numerical labels on each segment ensure accurate data communication. With 2 slide variations, you can choose different color combinations to match your presentation theme.
-
Recommended For
Recommended for executives, marketing teams, sales teams, and planning departments presenting quarterly results, market share, customer analysis, or budget status. Particularly suitable for presentations comparing departmental performance or visualizing metrics by product, region, or customer segment. Applicable to investor presentations, shareholder meetings, and internal reporting materials.
-
Slide Structure
2-slide set, each featuring a segmented column chart with 4 items (value 01-04) divided into 3-4 data series. Slide 1 uses teal, black, and orange; Slide 2 uses dark blue, black, and red for color variation. Each segment displays numerical labels, with an office worker character and text area positioned on the left side of the chart.
Related Products
-

Visualization of Learning Response Data – Market Trend Analysis
#Market and Competitor Analysis #Graph #Future Outlook
-

Big Data Market Analysis Graph – Trends and Performance
#Market and Competitor Analysis #Financial Plans and Performance #Diagram
-

Tablet PC Mockup Vertical Bar Graph – Market Analysis and Tech Insights
#Business Introduction #Market and Competitor Analysis #Graph
-

Medical Services Characteristics Connection Diagram
#Market and Competitor Analysis #Graph #Customer Analysis
