Segmented Analysis of Interior Trends – Data Visualization for Market Analysis
RB0700030_4
- Last Update 03/17/2025
- File Size 4.8MB
- # of Slides 2
- File Format PPTX
- Slide Ratio 4:3
- Color
Keywords
- #Content-Based Slides
- #Design-Based Slides
- #Market and Competitor Analysis
- #Financial Plans and Performance
- #Graph
- #Market Analysis
- #Capital Requirements
- #Column
- #Segmented Column
- #4:3
- #stacked bar chart PowerPoint
- #segmented data visualization slide
- #market analysis chart template
- #4-series comparison graph
- #data visualization PowerPoint download
About the Product
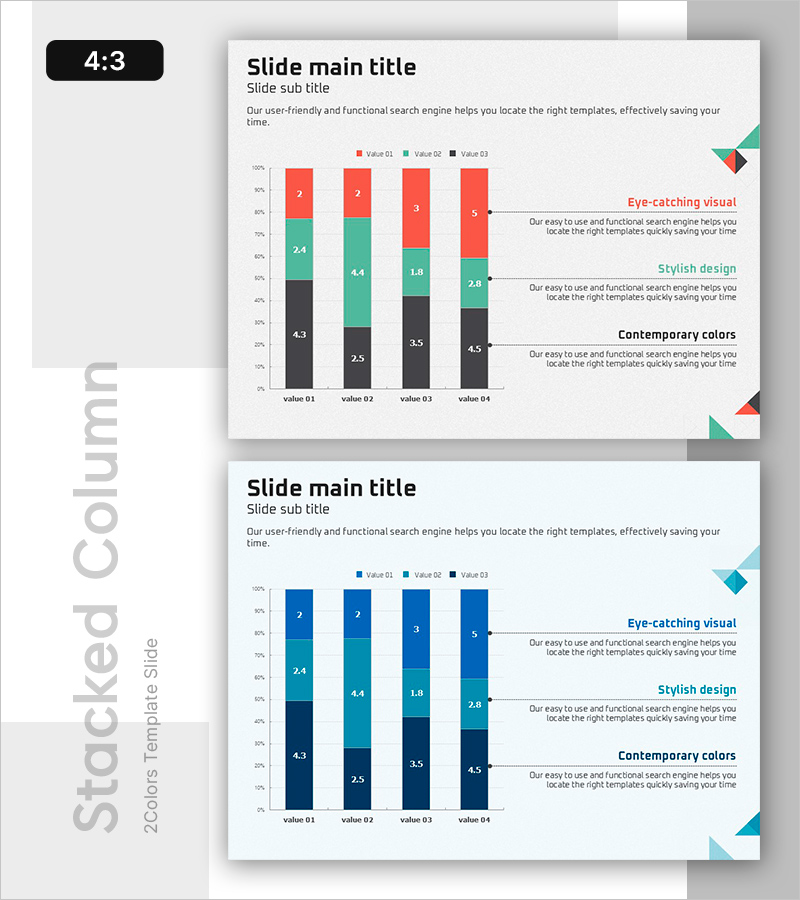
A stacked segmented bar chart PowerPoint slide optimized for interior market analysis and financial performance reporting. This slide visualizes four data series using a percentage-based stacked bar structure with three color segments: gray, green, and red. Each bar is divided into four subsections, making it ideal for comparing complex multi-layered data. The right side features three text annotation areas for highlighting key insights and findings. Delivered in 4:3 aspect ratio with 2 slides ready for immediate presentation use.
Usage Points
-
Main Usage
Designed to display both compositional ratios and series-by-series trends simultaneously. Ideal for interior market segmentation analysis, product category revenue breakdown, customer demographic purchasing patterns, and multi-dimensional data comparisons. Percentage-based representation conveys relative proportions intuitively to audiences.
-
How to Use
Use in market analysis sections to show competitive positioning, customer segmentation, and product portfolio composition. In financial reports, visualize revenue streams by source, cost allocation by category, and departmental budget distribution. Replace the sample values with your actual data and annotations to create presentation-ready slides instantly.
-
Recommended For
Recommended for marketing plans, business reports, investor pitch decks, quarterly performance presentations, and market research reports. Particularly suited for interior design, construction, real estate, and retail industries analyzing market trends and financial outcomes. Enhances data credibility in executive briefings, board meetings, and client presentations.
-
Slide Structure
Four values (value 01–04) each segmented into three series (gray, green, red) in stacked bar format. Each bar is normalized to 0–100% range with numeric labels on each segment. Three text boxes on the right side serve as annotation areas for key messages, insights, and supporting commentary.
Related Products
-

Company Service Analysis Graph – A Snapshot of Market Trends
#Market and Competitor Analysis #Financial Plans and Performance #Graph
-

Business Goal Analysis Graph – Realizing Business Vision
#Business Vision and Strategy #Market and Competitor Analysis #Diagram
-

Vertical Bar Market Analysis Segmentation Graph - Data Visualization
#Market and Competitor Analysis #Graph #Competitor Analysis
-

Pork Consumption Stack Chart – Market Trend Analysis
#Market and Competitor Analysis #Graph #Market Analysis
