Sales and Profit Calculation Table – Essential Tool for Business Strategy
RJ0300016_12
- Last Update 04/22/2025
- File Size 1.3MB
- # of Slides 2
- File Format PPTX
- Slide Ratio 16:9
- Color
Keywords
- #Content-Based Slides
- #Design-Based Slides
- #Business Strategy
- #Financial Plans and Performance
- #Diagram
- #Achievements
- #Sales and Revenue
- #Table
- #Standard Table
- #16:9
- #sales profit calculation table PowerPoint
- #financial table slide template
- #business strategy data sheet
- #revenue analysis presentation
- #profit planning spreadsheet
About the Product
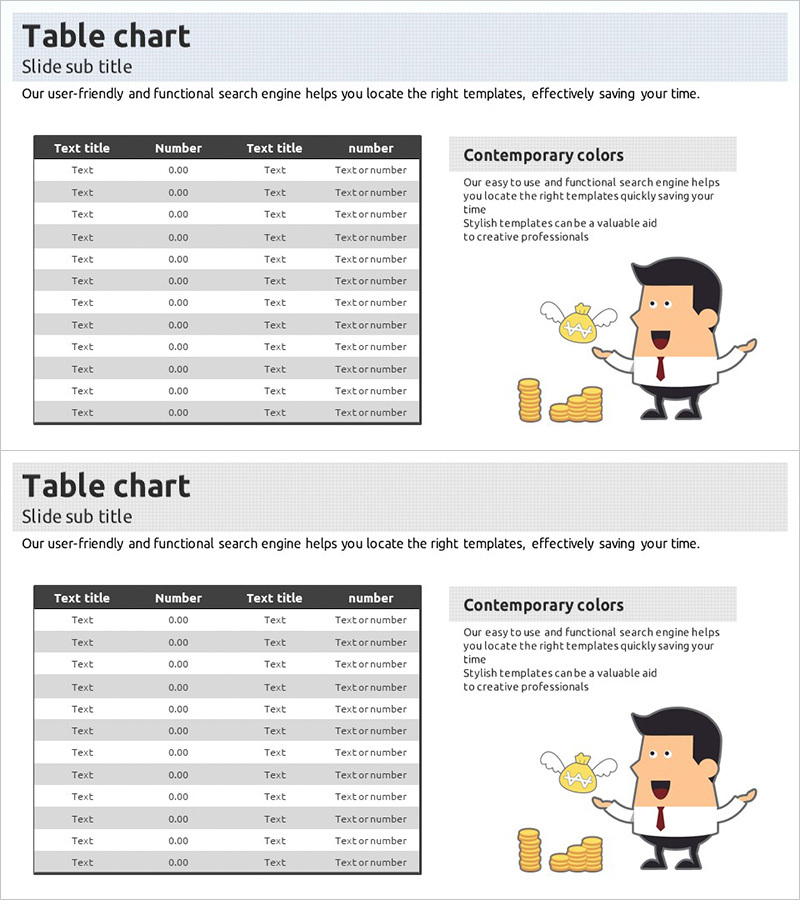
An essential PowerPoint slide for business strategy planning featuring a sales and profit calculation table. This 2-slide set provides identical table layouts with four columns: text title, number, text title, and number value, enabling systematic organization of financial information. The dark header and light gray body create clear visual hierarchy for easy data comprehension at a glance. The right side includes a modern illustration with a 'Contemporary colors' section offering template usage guidance. Available in 16:9 widescreen PPTX format for immediate editing, suitable for financial presentations including revenue analysis, profit planning, and business performance reporting.
Usage Points
-
Main Usage
A data table slide designed to analyze and compare business financial status using numerical data. Input key financial metrics such as revenue, profit margin, expenses, and net income by row, and list multiple periods, departments, or product figures by column for comparative analysis. This is a critical element for strengthening financial credibility in business plans, investor pitch decks, and quarterly performance reports.
-
How to Use
Simply enter the corresponding item names and figures in each cell. Replace the header row labels 'Text title'·'Number'·'Text title'·'Number' with your analysis categories (e.g., quarters, departments, product names), then input specific values in the rows below. Both slides share identical layouts, allowing you to present multiple data sets or analyze the same data from different perspectives.
-
Recommended For
Ideal for CFOs, finance managers, business planning teams, and executives organizing financial status and creating decision-making materials. Particularly suited for quarterly and annual performance reports, departmental profitability analysis, product-by-product sales comparison, and return on investment (ROI) analysis presentations based on quantitative data.
-
Slide Structure
Both slides feature identical structure: title area at top + 4-column data table in center (1 header row + 10 data rows). Left two columns contain item names (text), right two columns contain numerical data (numbers). Header features dark gray background with white text, while data rows use light gray background for clear distinction.
Related Products
-

KPI Target vs Actual Slide – 4-Metric Dark Red & Purple
#Company Introduction #Business Strategy #Financial Plans and Performance
-

Orange Red Point Table – Visualization of Financial Performance
#Financial Plans and Performance #Diagram #Sales and Revenue
-

Infographic Design Wide Template Map&Table
#Market and Competitor Analysis #Financial Plans and Performance #Diagram
-

Camera and Vertical Stacked Charts Slide
#Business Strategy #Financial Plans and Performance #Graph
