Yellow Green Detailed Analysis Chart - Visualizing Market Trends
RJ0600038_14
- Last Update 07/01/2025
- File Size 0.2MB
- # of Slides 2
- File Format PPTX
- Slide Ratio 16:9
- Color
Keywords
- #Content-Based Slides
- #Design-Based Slides
- #Business Strategy
- #Market and Competitor Analysis
- #Diagram
- #Graph
- #Achievements
- #Industry Trends
- #Table
- #Horizontal Bar
- #Standard Table
- #Segmented Horizontal Bar
- #16:9
- #horizontal bar chart PowerPoint
- #year-over-year comparison slide
- #market trend analysis chart
- #business performance visualization PPT
- #bar graph presentation template
About the Product
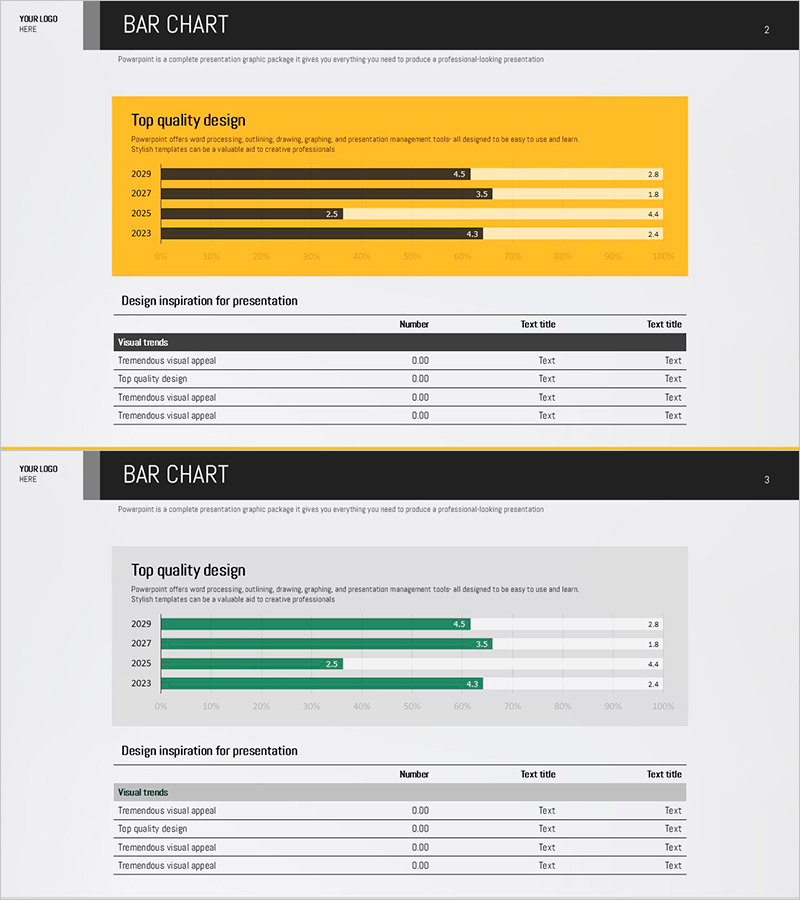
A horizontal bar chart PowerPoint slide optimized for market trend analysis and business performance comparison. The design features a yellow background with dark green and light yellow bar series, displaying four annual data points (2029, 2027, 2025, 2023) for intuitive numerical comparison. Each bar includes value labels on the right side for precise data communication, and a table section below allows additional descriptive information input. This presentation slide template is ready for immediate use in business reports and analysis decks.
Usage Points
-
Main Usage
Visualizes year-over-year and item-by-item numerical comparisons and market trends. This chart slide supports data-driven decision-making in business performance reports, market analysis, and management status presentations.
-
How to Use
Input actual values into the horizontal bar chart and add explanatory text (Visual trends, Top quality design, etc.) in the table below. Colors and value labels are pre-configured, allowing immediate use in presentations without additional formatting.
-
Recommended For
Recommended for executives, marketing teams, sales teams, analysts, and consultants presenting quarterly or annual performance comparisons, market size changes, and competitive analysis. Ideal for the data analysis section of business plans, reports, and proposals.
-
Slide Structure
Consists of a title area in the yellow header box, a central horizontal bar chart with four data series in dark green and light yellow, value labels on the right, and a four-row table below (Visual trends, Top quality design, and other items) across 2 slides.
Related Products
-

Comparison Graph of Business Trends by Year – Performance and Market Trends
#Business Strategy #Market and Competitor Analysis #Graph
-

100% Stacked Column Chart Slide – Performance and Market Trends
#Business Strategy #Market and Competitor Analysis #Graph
-

Stacked Bar Graph for Growing Market Trends – Business Strategy
#Business Strategy #Market and Competitor Analysis #Graph
-

Red Green Market Analysis Slide – Effective Data Visualization
#Business Strategy #Market and Competitor Analysis #Diagram
