Column Chart for Market Status and Future Prospects – Harmony of Blue and Navy
RJ0300015_9
- Last Update 04/22/2025
- File Size 0.3MB
- # of Slides 2
- File Format PPTX
- Slide Ratio 16:9
- Color
Keywords
About the Product
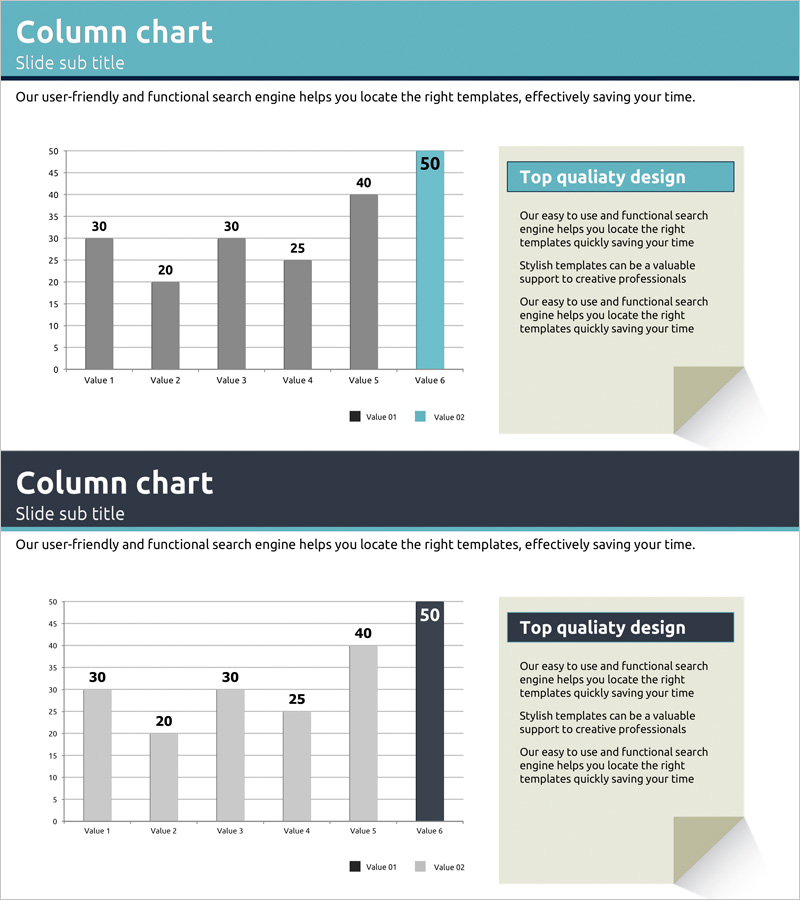
This free column chart PowerPoint slide enables you to compare market status and future prospects at a glance. The harmonious combination of dark gray and light turquoise clearly distinguishes two data series, while the right-side text box accommodates additional explanations. With just one slide, you can convey complex numerical data intuitively for immediate presentation use. Simply replace the text and values to insert this PPT slide into business plans, reports, proposals, or any document. This free download slide features simple editing, making it easy for beginners to customize. Explore more diverse chart types and slide designs in GoodPello's collection.
Usage Points
-
Main Usage
This slide visualizes and compares two or more data series across six categories. It's ideal for any presentation requiring comparative analysis such as market status, future outlook, performance comparison, or competitive analysis.
-
How to Use
Replace the graph values (30, 20, 30, 25, 40, 50) with your data, update the legend names (Value 01/02), and modify the right text box content. You can keep the colors and layout as-is or adjust them as needed.
-
Recommended For
Recommended for business professionals, marketing managers, planners, and analysts who need data-driven presentations for business plans, reports, proposals, and investor pitch decks.
-
Slide Structure
Single-slide composition featuring title, subtitle, column chart with six categories and two data series, legend, and right-side information box with three-line text area.


