Customer and Market Share Analysis Pie Chart Slide
RJ0300015_5
- Last Update 04/22/2025
- File Size 0.3MB
- # of Slides 2
- File Format PPTX
- Slide Ratio 16:9
- Color
Keywords
About the Product
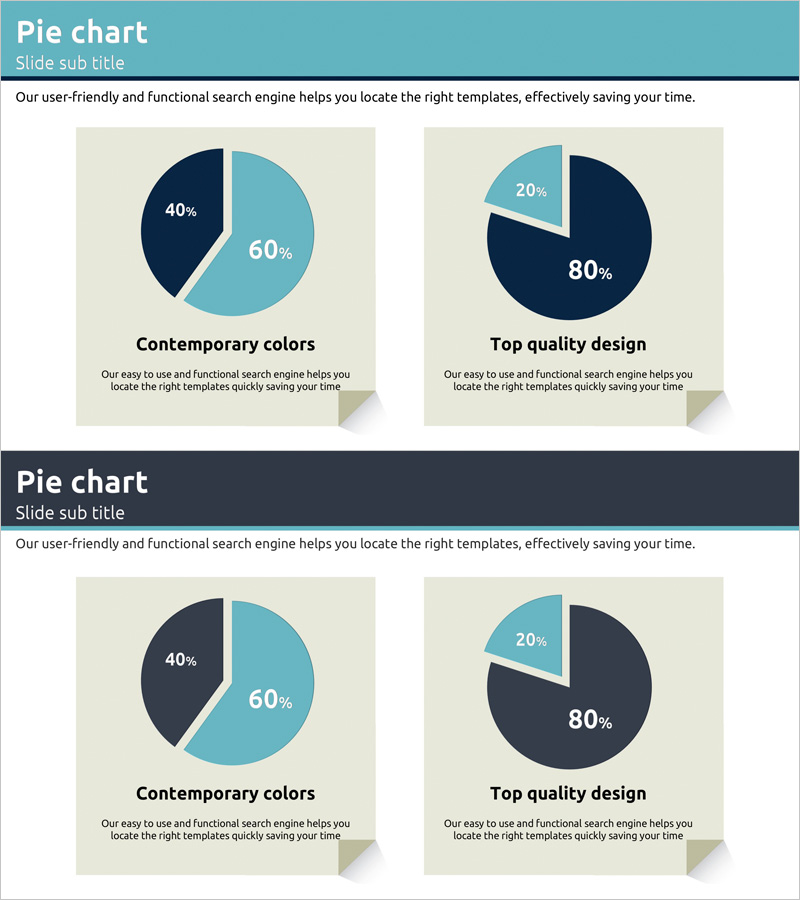
A 2-slide pie chart set designed for customer analysis and market share visualization. Features a two-tone color scheme combining navy and teal to clearly represent data proportions, with each slide displaying different segment ratios (40:60 and 20:80). The card-style layout on a beige background integrates titles and descriptive text, making it ready for immediate use in presentations and reports. Delivered in PowerPoint 16:9 widescreen format, PPTX file type, fully editable across all versions.
Usage Points
-
Main Usage
Visualizes two data categories simultaneously—customer composition ratios and market share distribution. Each pie chart represents different proportion structures (40:60 and 20:80), accommodating various analytical scenarios while clearly displaying percentage values and legends for audience comprehension.
-
How to Use
Apply in business plan market analysis sections, quarterly performance reports, and investor pitch decks when explaining customer demographics or competitive market positioning. The card layout with integrated title and descriptive text enhances audience understanding and engagement.
-
Recommended For
Marketing managers, sales directors, business analysts, management consultants, and executives preparing customer segmentation, competitive landscape, and market share reports. Particularly suited for B2B proposals and executive briefing materials.
-
Slide Structure
2-slide composition. First slide features 40% vs 60% pie chart in navy-teal two-tone; second slide shows 20% vs 80% pie chart in matching colors. Each slide includes title area, legend, and descriptive text zones. 16:9 widescreen format with beige card-style background design.
Related Products
-

Pie Chart Presentation Template for Market Analysis - Visual Appeal and Contemporary Colors
#Market and Competitor Analysis #Graph #Customer Analysis
-

User Analysis on Coffee and Smoking – Market Trends and Insights
#Market and Competitor Analysis #Graph #Other
-

Visual Slide Explaining Communication Breakdown and Performance Impact
#Market and Competitor Analysis #Graph #Customer Analysis
-

Camera Pie Chart – Market Share Analysis
#Market and Competitor Analysis #Graph #Other
