User Analysis on Coffee and Smoking – Market Trends and Insights
RJ0400037_15
- Last Update 05/27/2025
- File Size 5.6MB
- # of Slides 2
- File Format PPTX
- Slide Ratio 16:9
- Color
Keywords
About the Product
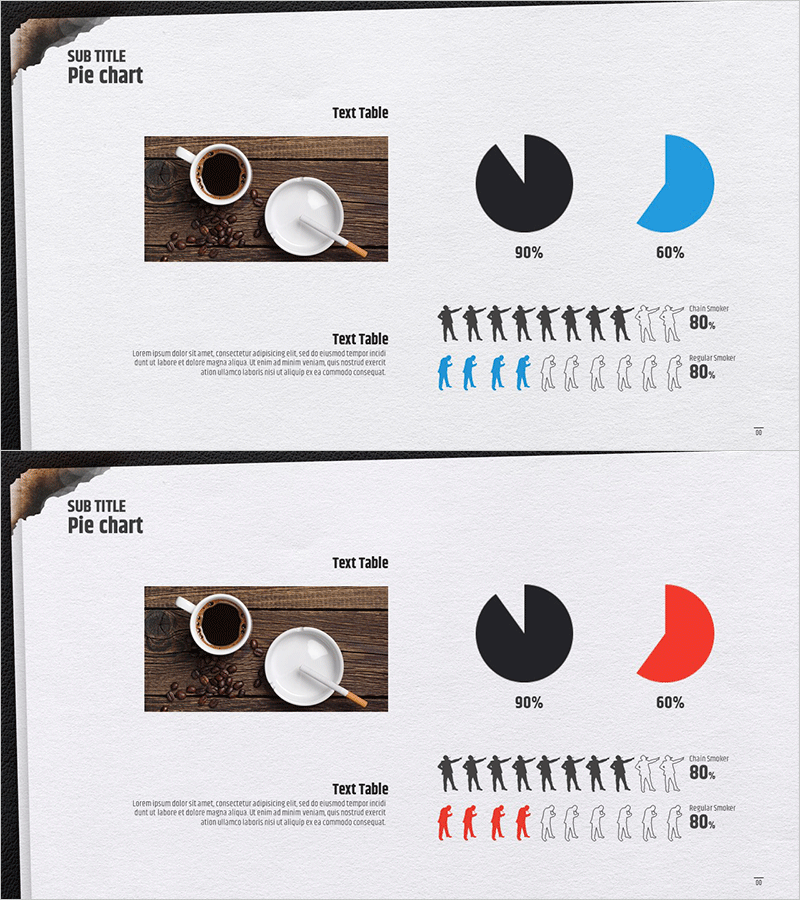
A 2-slide pie chart PowerPoint template for visualizing user analysis and market trend data. Features contrasting pie charts in black with blue and red accent colors to clearly express ratio comparisons. Real-world imagery (coffee cups) and silhouette icons are strategically placed to convey both qualitative and quantitative insights. Delivered in 16:9 widescreen PPTX format for immediate editing and use in consumer behavior analysis, market segmentation, and user statistics presentations.
Usage Points
-
Main Usage
Visualize ratio-based data such as consumer behavior analysis, market segmentation, and user statistics using pie charts for direct integration into presentations. Two chart versions—one with black and blue, another with black and red—accommodate diverse presentation scenarios.
-
How to Use
Slide 1 displays a black and blue pie chart for the first dataset, while Slide 2 presents a black and red pie chart for comparative data. Reference the included imagery and icons, then input your own text and numerical values to match your topic.
-
Recommended For
Marketing analysts, market research professionals, business consultants, and academic presenters explaining consumer preferences, market share, and user segmentation data in reports and presentations.
-
Slide Structure
2-slide layout. Each slide features a title area at the top, real-world imagery or icons on the left, and a 2-segment pie chart (showing 90% and 60% ratios) on the right. A text table area at the bottom allows for additional explanatory content.
Related Products
-

Drug Addiction Gender Ratio Analysis Graph - Customer Analysis
#Market and Competitor Analysis #Graph #Other
-

Camera Pie Chart – Market Share Analysis
#Market and Competitor Analysis #Graph #Other
-

Human Analysis Chart – Visualizing Customer Analysis and Market Share
#Market and Competitor Analysis #Graph #Other
-

Hobby Pie Charts for Visualizing Customer Analysis – Market Share
#Market and Competitor Analysis #Graph #Customer Analysis
