Toys and Pie Chart Analysis – Visual Data for Customer Insights
RJ0500003_6
- Last Update 06/08/2025
- File Size 6.3MB
- # of Slides 2
- File Format PPTX
- Slide Ratio 16:9
- Color
Keywords
About the Product
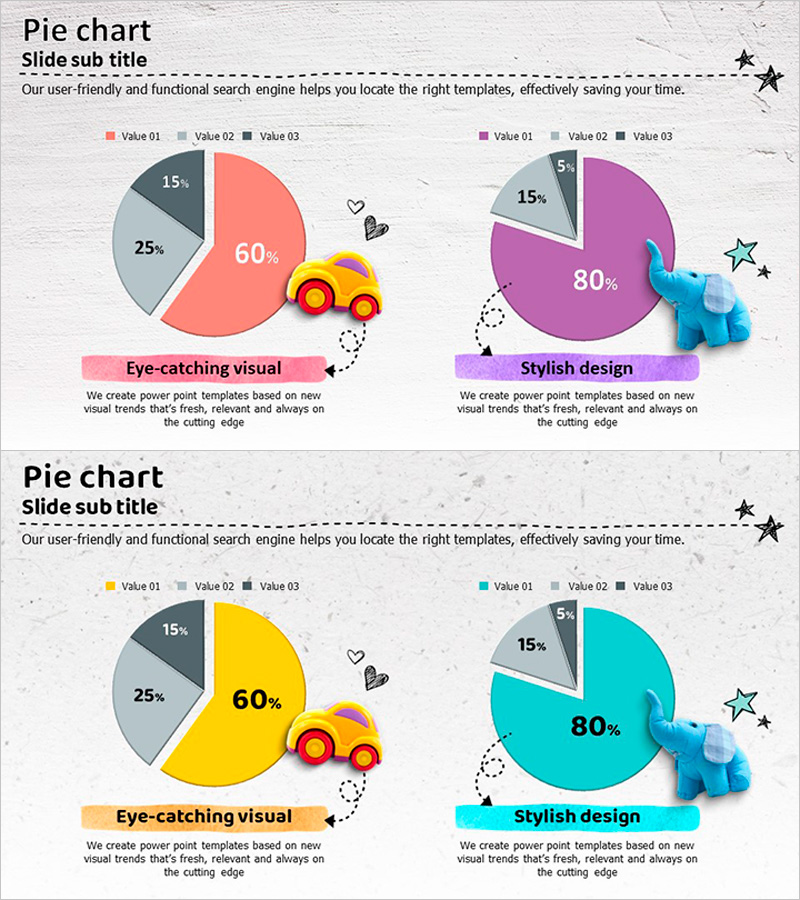
A 2-slide PowerPoint template designed for customer analysis and market research presentations. Features three color variations—coral, purple, and yellow—each displaying data distribution across three segments (60%, 25%, 15% ratios). Includes toy icons and vehicle illustrations to enhance data storytelling. Available in 16:9 widescreen PPTX format with fully editable elements. Perfect for marketing reports, customer segmentation presentations, sales analysis, and data-driven business communications.
Usage Points
-
Main Usage
Visualize three-part data distribution such as customer segments, market share, or sales composition using pie chart format. Each segment displays percentage values clearly, enabling stakeholders to compare proportions at a glance during data-driven presentations.
-
How to Use
Insert into marketing reports for customer analysis sections, quarterly sales reviews, market research findings, or business performance dashboards. Easily customize colors, update percentages, and modify legend text to match your specific presentation context and branding.
-
Recommended For
Marketing managers, sales directors, business analysts, management consultants, and research professionals presenting data-driven insights. Particularly effective for customer profiling, product sales composition analysis, and market segmentation reporting.
-
Slide Structure
2-slide set with identical layout. Each slide contains one 3-segment pie chart with percentage labels and accompanying text area. Includes two color schemes: coral (60%), gray (25%), dark gray (15%) and purple (80%), gray (15%), light gray (5%). Toy and vehicle illustrations provide visual context and engagement.
Related Products
-

User Analysis on Coffee and Smoking – Market Trends and Insights
#Market and Competitor Analysis #Graph #Other
-

Men's Recommended Daily Intake Visualization – A Slide for Healthy Men
#Market and Competitor Analysis #Graph #Customer Analysis
-

Infographic Slide Visualizing a Woman's Recommended Daily Intake
#Market and Competitor Analysis #Graph #Customer Analysis
-

Customer and Market Share Analysis Pie Chart Slide
#Market and Competitor Analysis #Graph #Customer Analysis
