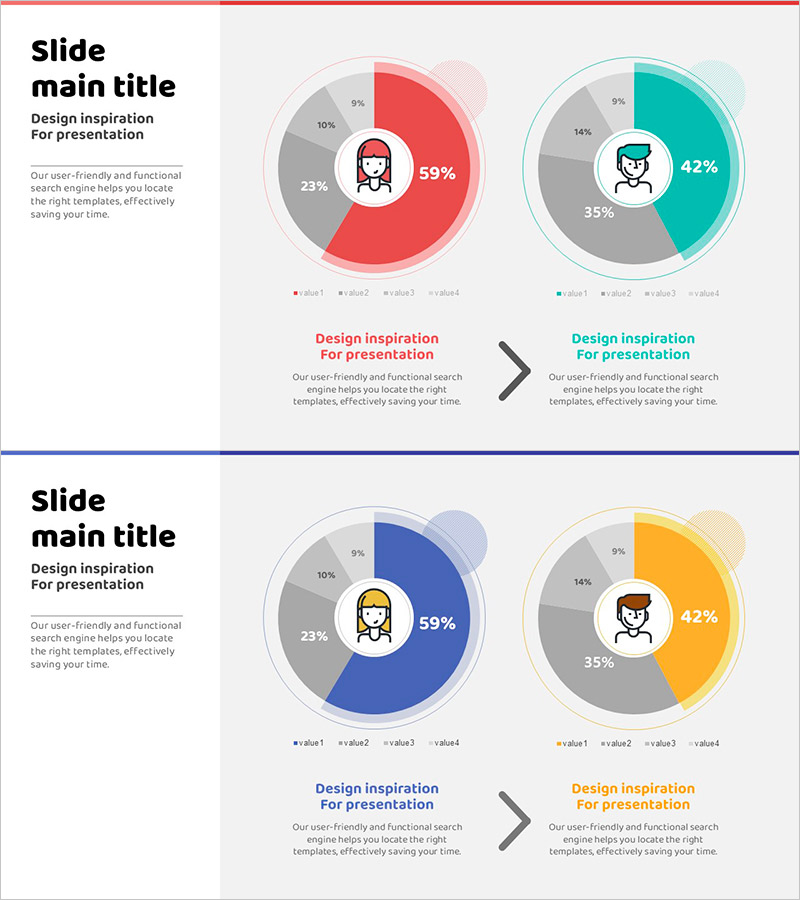
Donut Type Male and Female Analysis Chart – Customer Preference Analysis
RJ0500039_20
- Last Update 06/17/2025
- File Size 0.5MB
- # of Slides 2
- File Format PPTX
- Slide Ratio 16:9
- Color
Keywords
About the Product
A donut chart PowerPoint slide designed to compare and analyze male and female customer preferences. The circular graph is divided into four segments using red, teal, blue, and orange colors, with gender-specific icons in the center for intuitive differentiation. This 16:9 widescreen 2-slide template clearly displays market share, customer segmentation, and data visualization for presentations. Text and numerical values are fully editable, making it easy to customize for various analytical reports and business presentations.
Usage Points
-
Main Usage
Visually represents customer segmentation by gender, displaying market share and proportional data through a donut chart structure. The centered gender icons emphasize male-female distinction while clearly communicating segment percentages.
-
How to Use
Use in marketing reports, customer analysis presentations, and market research findings. Customize the colors, percentages, and labels to match your data, then insert into your presentation for a professional analytical display.
-
Recommended For
Marketing teams, sales departments, executives, market research analysts, and data professionals presenting customer segmentation strategies. Ideal for quarterly performance reports, new product target audience analysis, and customer satisfaction survey presentations.
-
Slide Structure
Two-slide template with centered gender icons and donut charts on each slide. Four segments (value1–value4) display proportional data with percentages (9%, 10%, 23%, 59%, etc.) and legend indicators. Optimized for 16:9 widescreen format in modern presentation environments.
Related Products
-

Infographic Slide Visualizing a Woman's Recommended Daily Intake
#Market and Competitor Analysis #Graph #Customer Analysis
-

Men's Recommended Daily Intake Visualization – A Slide for Healthy Men
#Market and Competitor Analysis #Graph #Customer Analysis
-

Visual Slide Explaining Communication Breakdown and Performance Impact
#Market and Competitor Analysis #Graph #Customer Analysis
-

Human Analysis Chart – Visualizing Customer Analysis and Market Share
#Market and Competitor Analysis #Graph #Other
