Line Graph Analysis Slide – Analyze the Market with Blue and Navy
RJ0300015_13
- Last Update 04/21/2025
- File Size 0.4MB
- # of Slides 2
- File Format PPTX
- Slide Ratio 16:9
- Color
Keywords
- #Content-Based Slides
- #Design-Based Slides
- #Market and Competitor Analysis
- #Graph
- #Competitor Analysis
- #Market Analysis
- #Line
- #Line Chart
- #16:9
- #line chart PowerPoint slide
- #trend analysis presentation template
- #multi-series data visualization
- #market analysis slide
- #how to create line graph in PowerPoint
About the Product
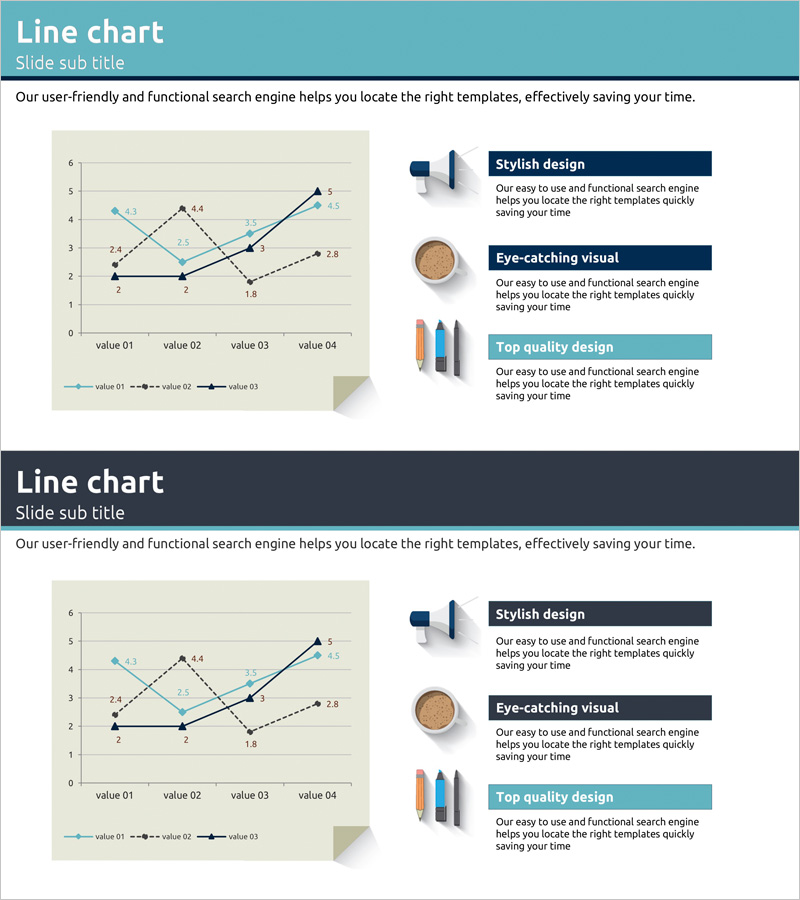
A multi-series line chart PowerPoint slide that compares three data trends across four time points (value 01 to value 04). The teal background features three distinct lines in navy blue, black, and dashed style, with precise numerical labels at each data point for clear trend visualization. Ideal for market analysis, competitive benchmarking, and performance tracking presentations. The 2-slide set supports various presentation scenarios and is optimized for 16:9 widescreen displays, enabling immediate use in business reports and strategic reviews.
Usage Points
-
Main Usage
Effectively compare multiple data trends over time to reveal patterns and performance changes. Perfect for presenting market growth, sales trends, competitor performance, and customer satisfaction metrics with quantitative precision and visual clarity.
-
How to Use
Each data series is distinguished by line color and style (solid vs. dashed), making it easy for audiences to track individual trends. Numerical labels on every data point ensure accurate value communication, while the right-side information boxes highlight key insights and analysis conclusions.
-
Recommended For
Marketing professionals, executives, data analysts, and consultants presenting quarterly or annual performance reviews, market analysis findings, and competitive strategy discussions. Particularly effective for business intelligence and strategic planning presentations.
-
Slide Structure
2-slide set with identical layouts. Each slide features a multi-series line chart on the left (Y-axis 0–6, X-axis value 01–04 with 3 data lines) and three vertically stacked information boxes on the right highlighting stylish design, visual impact, and quality design elements.
Related Products
-

Competitor Technology Comparison Graph – Market and Competitor Analysis
#Market and Competitor Analysis #Graph #Competitor Analysis
-

Black Navy Broken Line Graph Table – Market and Competitor Analysis
#Market and Competitor Analysis #Diagram #Graph
-

Project Market Environment Analysis Chart – Powerful Competitive Strategy
#Market and Competitor Analysis #Graph #Competitor Analysis
-

Space Illustration Theme Broken Line Graph
#Market and Competitor Analysis #Graph #Competitor Analysis
