Vertical Bar Segmentation Graph – A Powerful Tool for Market Analysis
RJ0300014_8
- Last Update 04/21/2025
- File Size 4.5MB
- # of Slides 2
- File Format PPTX
- Slide Ratio 16:9
- Color
Keywords
- #Content-Based Slides
- #Design-Based Slides
- #Market and Competitor Analysis
- #Graph
- #Market Status
- #Market Analysis
- #Column
- #Segmented Column
- #16:9
- #vertical bar chart PowerPoint
- #segmented bar graph template
- #data comparison slide
- #time-series chart
- #2-series stacked column
- #market analysis presentation
About the Product
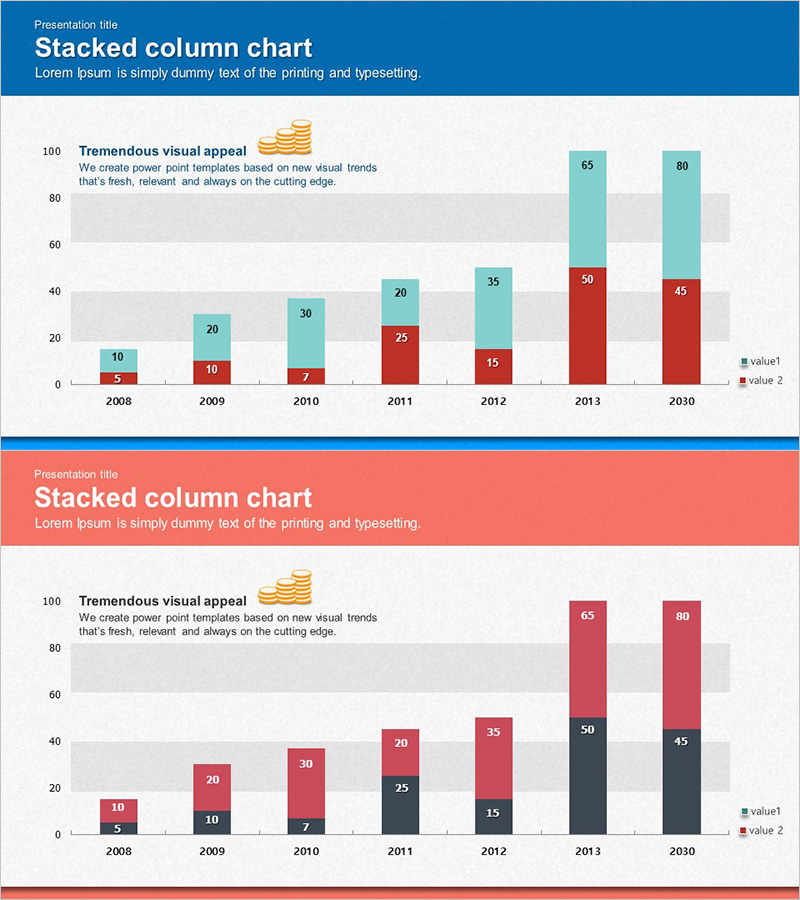
A vertical bar segmentation chart PowerPoint slide that displays time-series data from 2008 to 2030 across two distinct data series. Each series is clearly differentiated using blue and red colors, enabling intuitive year-over-year comparison of numerical changes. This presentation slide is ready for immediate use in diverse business contexts including market analysis, competitive benchmarking, and sales performance reporting. Provided in 16:9 widescreen format with 2 slides, featuring numerical labels and legend for easy data interpretation and audience comprehension.
Usage Points
-
Main Usage
Optimized for comparing two or more data series across years or categories while visualizing trends simultaneously. The stacked bar structure within each column allows viewers to grasp both total magnitude and individual series performance at once, with numerical labels ensuring precise data communication.
-
How to Use
Use in executive reports, quarterly performance presentations, and market research result sharing. Simply replace the year labels and numerical values with your own data for immediate deployment. Color adjustments can be made to align with brand identity. Display both slides sequentially or select individual slides as needed for your presentation flow.
-
Recommended For
Marketing managers, sales directors, financial analysts, management consultants, and data analysts presenting market conditions, sales results, competitive analysis, and financial performance. Ideal for any business presentation requiring multi-series data comparison and trend visualization.
-
Slide Structure
2-slide set with header area (title and description), chart area (vertical bar segmentation graph), and legend section on each slide. First slide displays 2-series data in blue and red; second slide features a red and gray color variation. Each bar is divided into 2 segments with numerical labels displayed at the top of each column.
Related Products
-

Market Analysis and Status Graph - Harmony of Blue and Orange
#Market and Competitor Analysis #Graph #Market Status
-

Internet Theme Segmentation Bar Graph – Market Status Analysis
#Market and Competitor Analysis #Graph #Market Status
-

Blue Pink Market Analysis Segmented Vertical Bar Graph
#Market and Competitor Analysis #Graph #Market Status
-

Trade Business Analysis Graph – Visualizing Market Status
#Market and Competitor Analysis #Graph #Market Status
