Employee Performance Evaluation Graph – Effective Visualization of Customer Success Cases
RJ0300014_6
- Last Update 04/21/2025
- File Size 4.4MB
- # of Slides 2
- File Format PPTX
- Slide Ratio 16:9
- Color
Keywords
- #Content-Based Slides
- #Design-Based Slides
- #Market and Competitor Analysis
- #Customer Success Stories
- #Graph
- #Market Share
- #Customer Testimonials and Feedback
- #Circles
- #Doughnut Chart
- #16:9
- #donut pie chart PowerPoint
- #pie graph slide template
- #employee performance evaluation chart
- #ratio visualization PPT
- #3-segment donut chart
About the Product
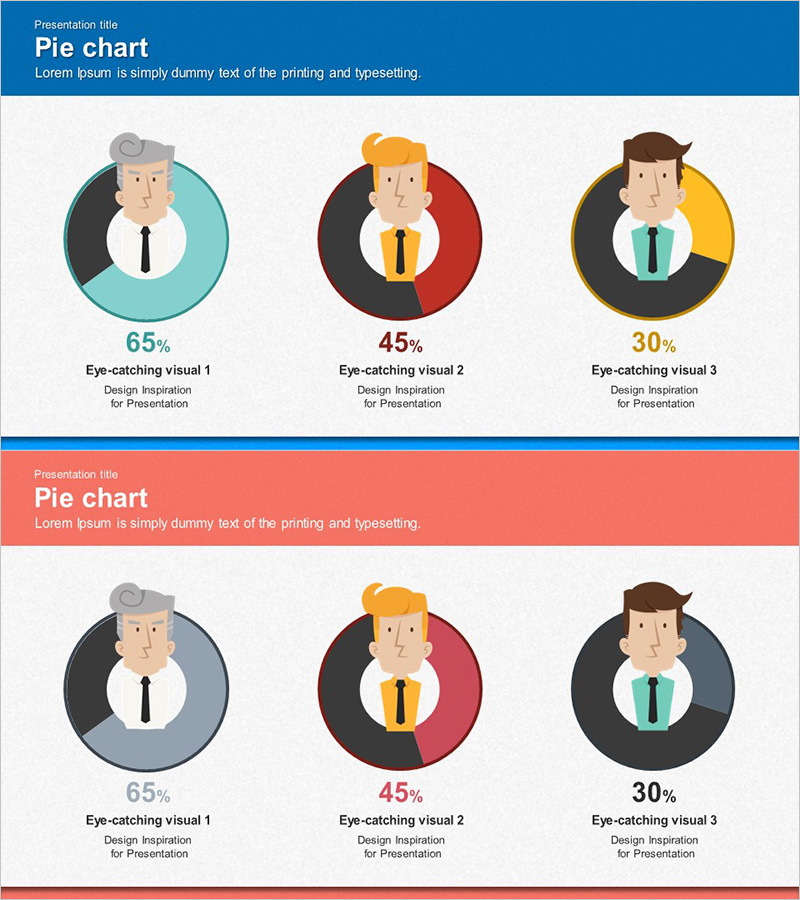
A donut-shaped pie chart PowerPoint slide designed to visualize employee performance evaluation and customer success cases. The circular graph is divided into three segments using teal, red, and gold colors, clearly representing the proportion of each category. Employee character icons positioned at the center of each chart intuitively convey the data theme. This 2-slide presentation in 16:9 widescreen format is ready for immediate use in various presentation environments, with fully editable text and numerical values. Ideal for ratio-based data analysis such as market share, departmental performance, and customer satisfaction metrics.
Usage Points
-
Main Usage
Visualize employee performance evaluation results, departmental performance ratios, and customer satisfaction distribution using donut-shaped pie charts. The central character icon emphasizes the presentation topic, while three distinct color segments enable quick comprehension of each category's proportion.
-
How to Use
Use in executive reports, team performance presentations, and customer success case-sharing sessions to effectively communicate quantitative data. Replace the percentage values and labels with your actual data, and customize colors and character icons to match your organizational brand identity.
-
Recommended For
HR professionals, team leaders, executives, and marketing managers can utilize this template for periodic performance reviews, departmental performance analysis, and customer satisfaction survey result presentations. It is equally effective for internal meetings and external presentations requiring intuitive ratio-based data communication.
-
Slide Structure
Two-slide composition featuring three donut pie charts arranged horizontally on each slide. Each chart includes a centered employee character icon with percentage values (65%, 45%, 30%) and descriptive text areas below. The 16:9 widescreen ratio optimizes compatibility with modern presentation environments.
Related Products
-

Musician Donut Chart – Market Share Visualization
#Market and Competitor Analysis #Customer Success Stories #Graph
-

VR System Development Status Analysis Graph – Visualization of Market Share
#Product/Service Introduction #Market and Competitor Analysis #Graph
-

Internet of Things Usage Share Analysis Circle Graph
#Product/Service Introduction #Market and Competitor Analysis #Graph
-

Space Industry Technology Status Graph – The Start of Innovation
#Product/Service Introduction #Market and Competitor Analysis #Graph
