Musician Donut Chart – Market Share Visualization
RJ0500020_18
- Last Update 06/12/2025
- File Size 0.7MB
- # of Slides 2
- File Format PPTX
- Slide Ratio 16:9
- Color
Keywords
- #Content-Based Slides
- #Design-Based Slides
- #Market and Competitor Analysis
- #Customer Success Stories
- #Graph
- #Market Share
- #Customer Testimonials and Feedback
- #Circles
- #Doughnut Chart
- #16:9
- #donut chart PowerPoint
- #pie chart slide template
- #ratio data visualization
- #market share PowerPoint
- #customer satisfaction chart
- #data comparison slide
About the Product
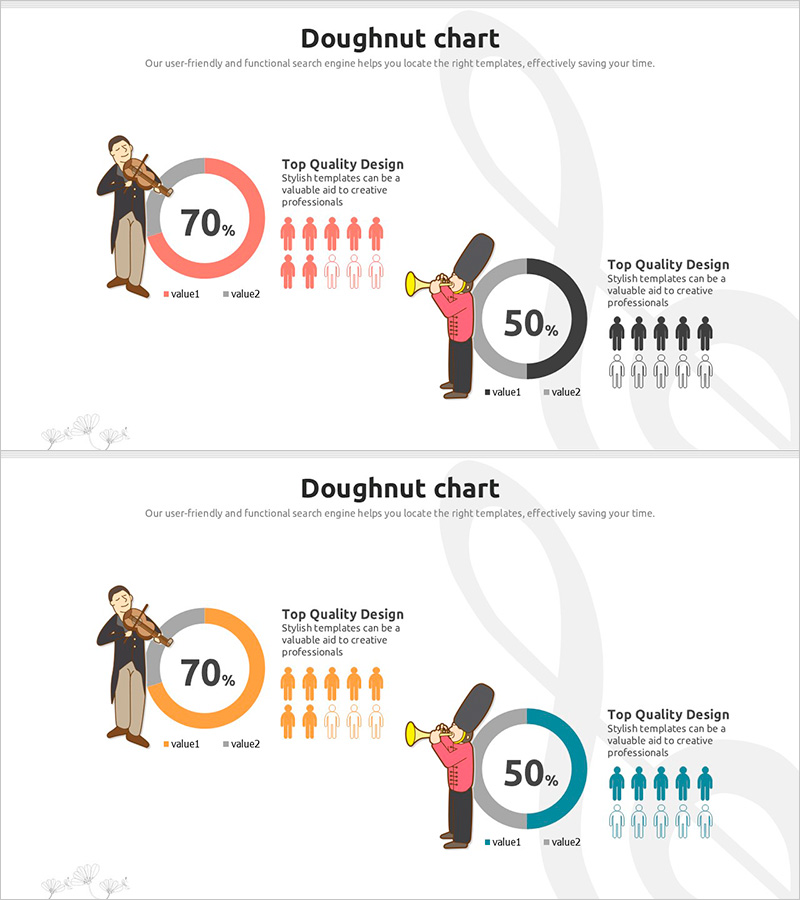
A professional donut chart PowerPoint slide designed to compare two data items side-by-side, such as market share, customer satisfaction, or sales distribution. Featuring illustrative characters and clear percentage displays (70%, 50%), this presentation template is ready to use in business reports, marketing proposals, and executive presentations. The neutral color palette—gray, orange, and black tones—adapts to any industry, while fully editable legend and text fields allow quick customization for your specific data.
Usage Points
-
Main Usage
Visualize and compare the ratio, composition, or market share of two data categories simultaneously. Perfect for presenting market share analysis, customer satisfaction ratings, sales distribution, budget allocation, and time management comparisons in a clear, impactful format.
-
How to Use
Insert your data into the two donut charts on slides 1 and 2 for comparative analysis. Double-click the percentage values and legend labels to edit, then reposition the character illustrations and text boxes to match your presentation style and branding.
-
Recommended For
Marketing professionals presenting market analysis, sales teams reporting customer satisfaction metrics, executives delivering business performance reviews, consultants preparing proposal decks, and educators creating seminar materials.
-
Slide Structure
2-slide set with one donut chart per slide featuring centered percentage display, character illustration, descriptive text area, and legend (value1 and value2). 16:9 widescreen format optimized for projector displays and online presentations.
Related Products
-

Employee Performance Evaluation Graph – Effective Visualization of Customer Success Cases
#Market and Competitor Analysis #Customer Success Stories #Graph
-

Navigation App Market Share Graph Analysis – Effective Data Visualization
#Market and Competitor Analysis #Graph #Market Share
-

VR System Development Status Analysis Graph – Visualization of Market Share
#Product/Service Introduction #Market and Competitor Analysis #Graph
-

Donut Graph by Caries Erosion Status – Essential for Market Analysis
#Business Introduction #Market and Competitor Analysis #Graph
