Premium Coffee Customer Demographics and Popular Menu – Comprehensive Customer Analysis
RM0100021_7
- Last Update 10/15/2025
- File Size 27.4MB
- # of Slides 2
- File Format PPTX
- Slide Ratio 16:9
- Color
Keywords
- #Content-Based Slides
- #Design-Based Slides
- #Market and Competitor Analysis
- #Customer Success Stories
- #Graph
- #Market Analysis
- #Customer Testimonials and Feedback
- #Horizontal Bar
- #Circles
- #Horizontal Bar Chart
- #Doughnut Chart
- #16:9
- #donut chart PowerPoint slide
- #customer demographics analysis template
- #gender distribution pie chart
- #customer analysis PowerPoint template
- #market analysis graph slide
About the Product
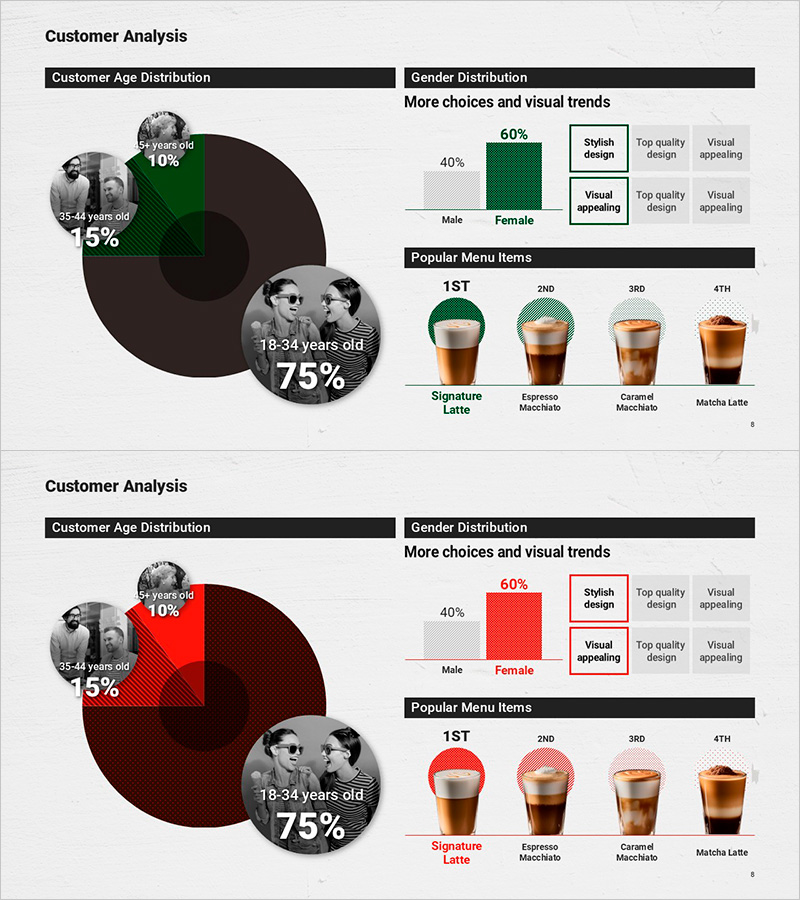
A comprehensive PowerPoint slide set featuring donut-shaped pie charts to visualize customer demographics and gender distribution for premium coffee brands. The presentation highlights the primary customer segment (18-34 years old, 75%) with age-based distribution ratios, alongside gender breakdown (Male 40% / Female 60%) and customer preference trends. Popular menu items are displayed with product images in ranked order (Signature Latte, Espresso Macchiato, Caramel Macchiato, Matcha Latte), making it immediately applicable for market analysis presentations. The 16:9 widescreen format across 2 slides fits seamlessly into customer analysis reports, marketing strategy decks, and business presentations.
Usage Points
-
Main Usage
Visualize customer demographic data using donut-shaped pie charts to instantly communicate age-based and gender-based customer composition ratios. Designed to highlight the primary customer segment (18-34 years, 75%) and gender preference differences in the premium coffee market, supporting targeted marketing strategy development.
-
How to Use
Slide 1 presents age-based customer distribution in donut chart format. Slide 2 displays gender distribution alongside customer preference trends (stylish design, product quality, visual appeal) in parallel layout. Popular menu items are represented with product images ranked by preference, allowing seamless integration into customer analysis presentations, marketing strategy documents, and business reports.
-
Recommended For
Coffee brand and café franchise marketing managers, market research analysts, business strategists developing customer segmentation strategies, product development teams requiring customer demographic analysis, and executives planning targeted marketing initiatives.
-
Slide Structure
2-slide composition: Slide 1 features a donut-shaped pie chart displaying age-based customer distribution (centered on 18-34 years, 75%) with percentage labels for each age segment. Slide 2 shows gender distribution (Male 40% / Female 60%) in bar format, customer preference trends (stylish design, product quality, visual appeal) in text boxes, and 4 popular menu items (Signature Latte, Espresso Macchiato, Caramel Macchiato, Matcha Latte) arranged by rank with product images.
Related Products
-

Donut Chart for Interior Satisfaction Survey
#Market and Competitor Analysis #Customer Success Stories #Graph
-

Market Trend Analysis Chart – Effective Data Visualization
#Market and Competitor Analysis #Graph #Market Analysis
-

Latest Trend Analysis Bar & Donut Charts
#Market and Competitor Analysis #Graph #Market Analysis
-

Market Demand Analysis PowerPoint Slide – Donut Chart Layout
#Market and Competitor Analysis #Graph #Customer Analysis
