Radial Graph of Data Analysis by Year – Market and Competitive Analysis
RJ0300014_16
- Last Update 04/21/2025
- File Size 4.4MB
- # of Slides 2
- File Format PPTX
- Slide Ratio 16:9
- Color
Keywords
- #Content-Based Slides
- #Design-Based Slides
- #Market and Competitor Analysis
- #Graph
- #Market Analysis
- #Other
- #Radar Chart Spider Chart
- #16:9
- #radial chart PowerPoint
- #5-axis radar chart template
- #year-over-year data comparison slide
- #market analysis PowerPoint template
- #competitive analysis chart download
About the Product
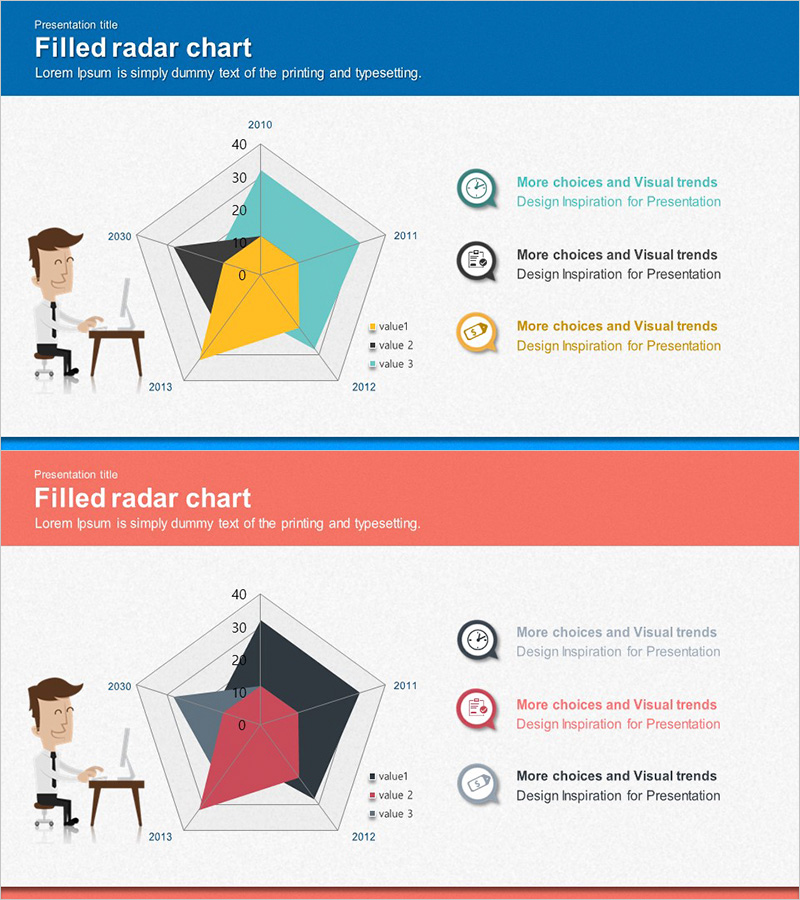
A PowerPoint slide template featuring a 5-axis radial chart for visualizing year-over-year data comparison. Includes 2 design versions in blue and orange color schemes, ideal for market analysis, competitive benchmarking, and performance evaluation. Each slide displays 3 data series simultaneously, with values radiating from the center point outward, enabling intuitive comparison of multiple metrics across different time periods. Delivered in 16:9 widescreen PPTX format, fully editable with customizable data values and legends to match your presentation needs.
Usage Points
-
Main Usage
Radial charts excel at displaying multiple dimensions simultaneously, revealing relative strengths and weaknesses across metrics at a glance. This template is optimized for year-over-year performance trends, competitive capability assessment, market share analysis, and multi-dimensional business metrics visualization.
-
How to Use
Integrate into business reports' market analysis sections, executive briefing materials, and strategic planning presentations. The blue version suits corporate presentations emphasizing stability and reliability, while the orange version highlights growth and dynamism in performance reports. Easily modify data values and legends to reflect your analysis results.
-
Recommended For
Marketing managers, business strategists, management consultants, financial analysts, sales directors, and data-driven decision makers. Particularly effective for competitive analysis, performance reviews, market research presentations, and quarterly business reviews.
-
Slide Structure
2-slide set. Each slide features a radial structure with 5 axes radiating from a central point, displaying 3 data series color-coded for distinction. Legend and descriptive text areas are positioned on the right side, with clear axis labels and gridlines for easy data reading.
Related Products
-

Market Share Analysis Area & Pie Chart – The Power of Data Visualization
#Product/Service Introduction #Market and Competitor Analysis #Graph
-

Geometric Pattern Wide PPT Radar Chart – Optimized for Market Analysis Visualization
#Market and Competitor Analysis #Graph #Market Status
-

Real Estate Analysis Charts by Consumer Characteristics – Graphs for Market Insights
#Product/Service Introduction #Market and Competitor Analysis #Graph
-

Derived Results by Radar Chart – Market and Competitor Analysis
#Product/Service Introduction #Market and Competitor Analysis #Graph
