Radar Chart Analysis Results – Market and Competitor Insights
RJ0600011_16
- Last Update 06/23/2025
- File Size 1.1MB
- # of Slides 2
- File Format PPTX
- Slide Ratio 16:9
- Color
Keywords
- #Content-Based Slides
- #Design-Based Slides
- #Product/Service Introduction
- #Market and Competitor Analysis
- #Graph
- #Features
- #Market Analysis
- #Other
- #Radar Chart Spider Chart
- #16:9
- #radial chart PowerPoint
- #radar chart slide template
- #market analysis presentation
- #competitor analysis PPT
- #multi-variable data visualization
- #6-item comparison chart
About the Product
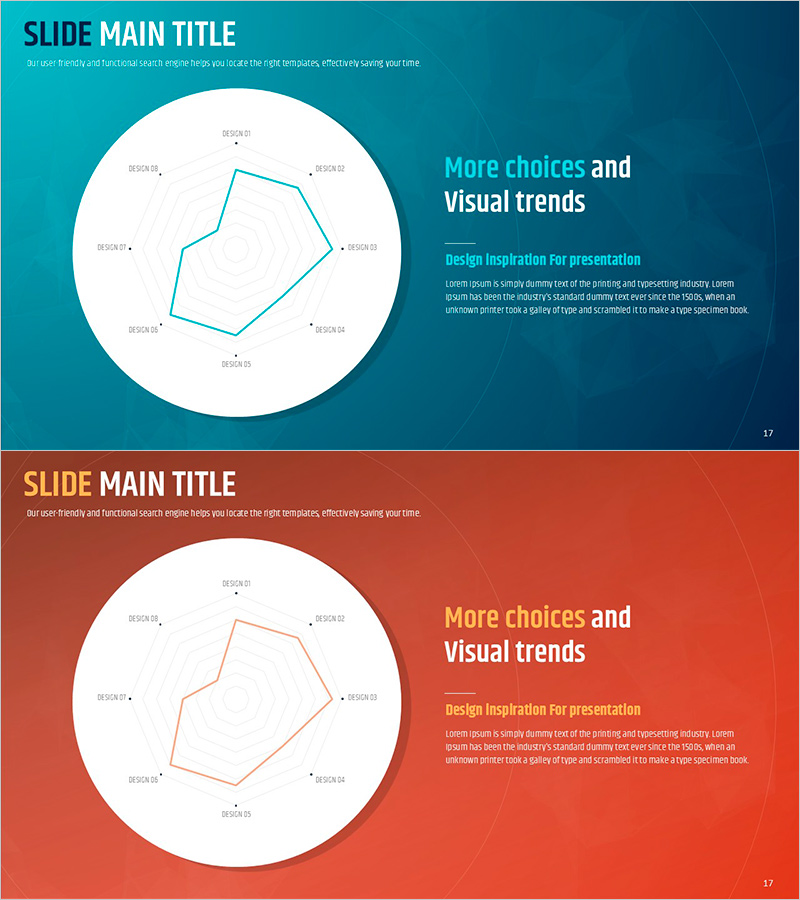
A 6-axis radial radar chart PowerPoint slide designed for market analysis and competitive insights. The design features a turquoise background with a white circular frame containing a cyan-colored polygon data structure, with analysis categories positioned along each axis for intuitive multi-variable comparison. The 2-slide set includes an identical layout in warm orange tones, providing color flexibility for different presentation contexts. Fully editable PPTX format allows you to input your own data and use it immediately in business presentations.
Usage Points
-
Main Usage
Compare multiple variables simultaneously to identify strengths, weaknesses, opportunities, and threats at a glance. Ideal for market positioning, competitive benchmarking, product performance evaluation, and organizational capability assessment by visualizing quantitative data in radial format to enhance pattern recognition.
-
How to Use
Replace axis labels with your analysis categories and input your company and competitor data at the polygon vertices. Use color selection (turquoise or orange) to distinguish between brands or comparison subjects. Apply to business strategy presentations, marketing planning, and investor pitch decks.
-
Recommended For
Strategy planning teams, marketing departments, executive reports, consulting proposals, and investment pitch materials. Ideal for presentations requiring multi-dimensional comparisons such as market analysis, competitive analysis, product positioning, and organizational capability assessment.
-
Slide Structure
Two slides featuring a 6-axis radial radar chart. Each slide contains a polygon data line within a centered circular frame, right-aligned text area with title and description, and gradient background. Available in two color versions: turquoise background with cyan data line and orange background with beige data line.
Related Products
-

Radial Graph for Indoor Lighting Effect Analysis – Modern Approach
#Product/Service Introduction #Market and Competitor Analysis #Marketing Plan and Strategy
-

Real Estate Analysis Charts by Consumer Characteristics – Graphs for Market Insights
#Product/Service Introduction #Market and Competitor Analysis #Graph
-

Derived Results by Radar Chart – Market and Competitor Analysis
#Product/Service Introduction #Market and Competitor Analysis #Graph
-

Business Direction Radial Chart – Market and Competitive Analysis
#Product/Service Introduction #Market and Competitor Analysis #Graph
