Real Estate Analysis Charts by Consumer Characteristics – Graphs for Market Insights
RJ0900010_24
- Last Update 08/18/2025
- File Size 1.1MB
- # of Slides 2
- File Format PPTX
- Slide Ratio 16:9
- Color
Keywords
- #Content-Based Slides
- #Design-Based Slides
- #Product/Service Introduction
- #Market and Competitor Analysis
- #Graph
- #Features
- #Market Analysis
- #Other
- #Radar Chart Spider Chart
- #16:9
- #radial chart PowerPoint
- #radial diagram slide template
- #8-axis data comparison
- #real estate analysis chart
- #market analysis graph
- #multi-variable visualization PowerPoint
About the Product
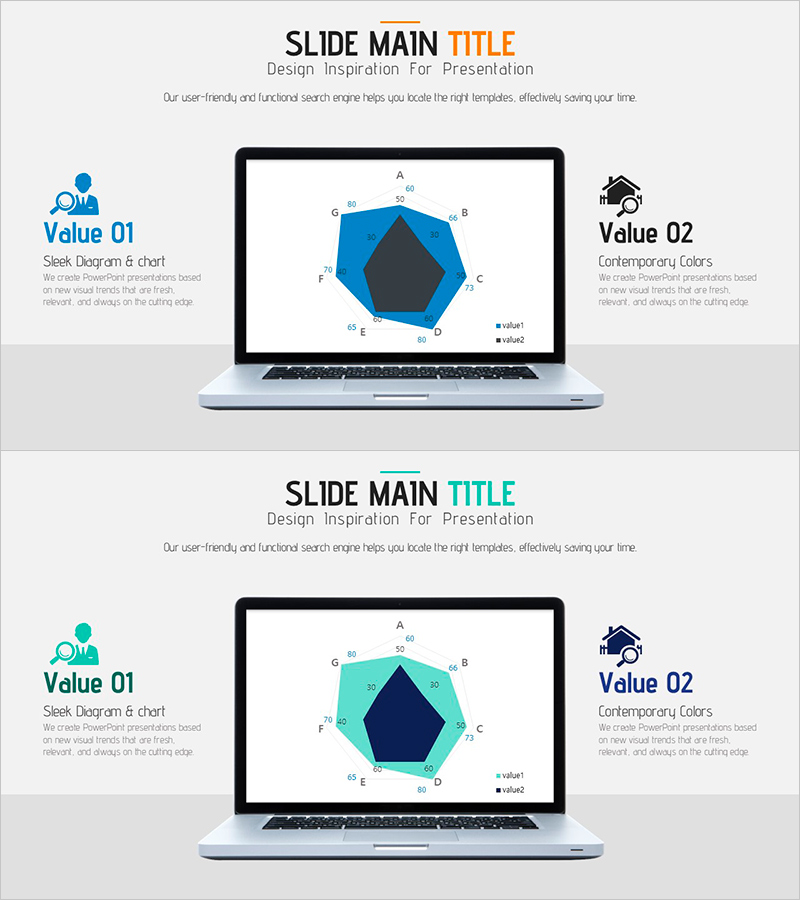
A radial chart PowerPoint slide optimized for real estate market analysis and consumer characteristics comparison. The design features eight axes radiating from a central core, enabling simultaneous comparison of multiple data points at a glance. The blue-toned transparent polygons with a dark navy center allow hierarchical information representation, while the legend displays two data series side by side. Delivered in 16:9 widescreen format with 2 slides, ready for immediate editing and presentation use.
Usage Points
-
Main Usage
Visualizes multiple variables simultaneously for real estate market analysis, consumer characteristics comparison, and competitive benchmarking. The radial structure extending from center to periphery intuitively expresses relationships between core items and detailed metrics, while dual-series comparison reveals differences and similarities clearly.
-
How to Use
Two-slide set featuring blue and cyan-toned radial charts. Customize each axis label and data value to match your analysis categories. The legend distinguishes between value1 and value2 for clear data differentiation. Select the color tone that best suits your presentation context and audience.
-
Recommended For
Ideal for real estate developers and agencies presenting market analysis, marketing teams reporting consumer insights, consulting firms conducting competitive analysis, and financial institutions presenting investment analysis. Highly effective for strategy meetings and executive briefings requiring multi-indicator comparison.
-
Slide Structure
Two radial polygon charts with 8 axes each. Each slide displays two transparent polygons (value1 and value2) radiating from a dark navy center across 8 directions, with left-side icons and descriptive text, and right-side legend for series differentiation.
Related Products
-

Radial Graph for Indoor Lighting Effect Analysis – Modern Approach
#Product/Service Introduction #Market and Competitor Analysis #Marketing Plan and Strategy
-

Radar Chart Analysis Results – Market and Competitor Insights
#Product/Service Introduction #Market and Competitor Analysis #Graph
-

Business Direction Radial Chart – Market and Competitive Analysis
#Product/Service Introduction #Market and Competitor Analysis #Graph
-

Derived Results by Radar Chart – Market and Competitor Analysis
#Product/Service Introduction #Market and Competitor Analysis #Graph
