Competitor Analysis Pentagon Radial Graph – Concept and Strategy
RM0400008_10
- Last Update 02/16/2025
- File Size 0.3MB
- # of Slides 2
- File Format PPTX
- Slide Ratio 16:9
- Color
Keywords
- #Content-Based Slides
- #Design-Based Slides
- #Market and Competitor Analysis
- #Graph
- #Competitor Analysis
- #Market Analysis
- #Other
- #Radar Chart Spider Chart
- #16:9
- #pentagon radial graph PowerPoint
- #competitor analysis slide template
- #radial diagram presentation
- #market comparison chart
- #how to create radial graph in PowerPoint
About the Product
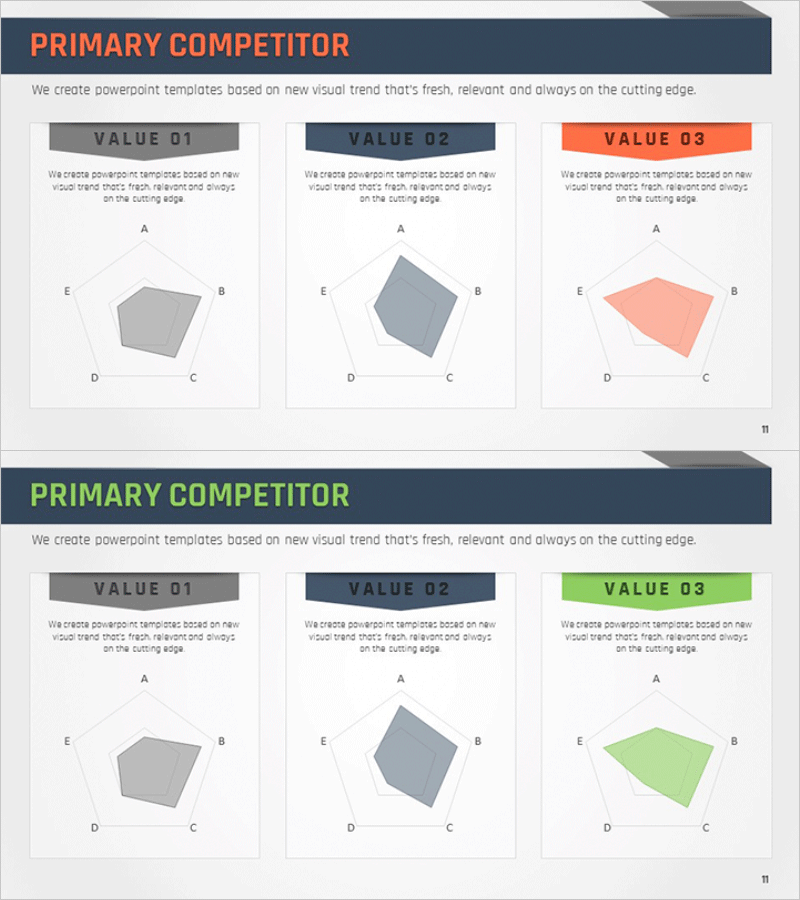
A pentagon radial graph PowerPoint slide designed for competitor analysis and market comparison. This presentation template features a radial structure that expands from a central core to five distinct dimensions (A through E), enabling visual comparison of competitor strengths across multiple criteria. The slide set includes three color variations—gray, dark gray, and coral—representing VALUE 01, 02, and 03 for easy differentiation between competitors or scenarios. Each pentagon vertex is labeled for straightforward data entry. The 2-slide deck in 16:9 widescreen PPTX format is fully editable and ready for immediate use in strategy presentations, market analysis, and product positioning discussions.
Usage Points
-
Main Usage
Visualize multi-dimensional competitor comparison and market positioning analysis using a radial graph structure. The five-point pentagon radiating from a central hub allows simultaneous assessment of competitor capabilities across key dimensions such as price, quality, technology, customer satisfaction, and market share.
-
How to Use
Insert into executive presentations, investor pitch decks, and strategic planning meetings within the competitive landscape analysis section. Assign comparison metrics (pricing, features, innovation, service quality, market reach) to each of the five pentagon vertices, then use the three color options to distinguish between your company and competing firms, making strengths and weaknesses immediately apparent.
-
Recommended For
Strategy teams, marketing departments, and business development professionals. Ideal for new market entry evaluation, product positioning strategy, and competitive intelligence briefings. Particularly valuable for consulting firms, corporate strategy offices, and investment due diligence teams presenting competitive environments to stakeholders.
-
Slide Structure
2-slide deck featuring three pentagon radial graphs per slide. Each pentagon radiates from a central point along five axes (A–E) with labeled vertices and data input zones. Three color schemes—gray, dark gray, and coral—distinguish VALUE 01, 02, and 03. 16:9 widescreen PPTX format with full editability.
Related Products
-

Geometry PPT Template Wide Radar Chart – Market and Competitor Analysis
#Market and Competitor Analysis #Graph #Competitor Analysis
-

Service Analysis Radial Graph – Market and Competitor Analysis
#Market and Competitor Analysis #Diagram #Graph
-

Competitor Growth Comparison Radial Chart
#Market and Competitor Analysis #Graph #Competitor Analysis
-

Brain Data Analysis Radial Graph – Insights on Technology and Market
#Market and Competitor Analysis #Diagram #Graph
