Sales and Profit Analysis Tables & Graphs – Data-Driven Insights
RJ0300013_9
- Last Update 04/21/2025
- File Size 0.1MB
- # of Slides 2
- File Format PPTX
- Slide Ratio 16:9
- Color
Keywords
- #Content-Based Slides
- #Design-Based Slides
- #Market and Competitor Analysis
- #Financial Plans and Performance
- #Diagram
- #Graph
- #Competitive Advantage
- #Sales and Revenue
- #Table
- #Horizontal Bar
- #Horizontal Table
- #Horizontal Bar Chart
- #16:9
- #horizontal bar chart PowerPoint
- #sales analysis slide template
- #financial data visualization
- #dual-series chart template
- #business comparison chart download
About the Product
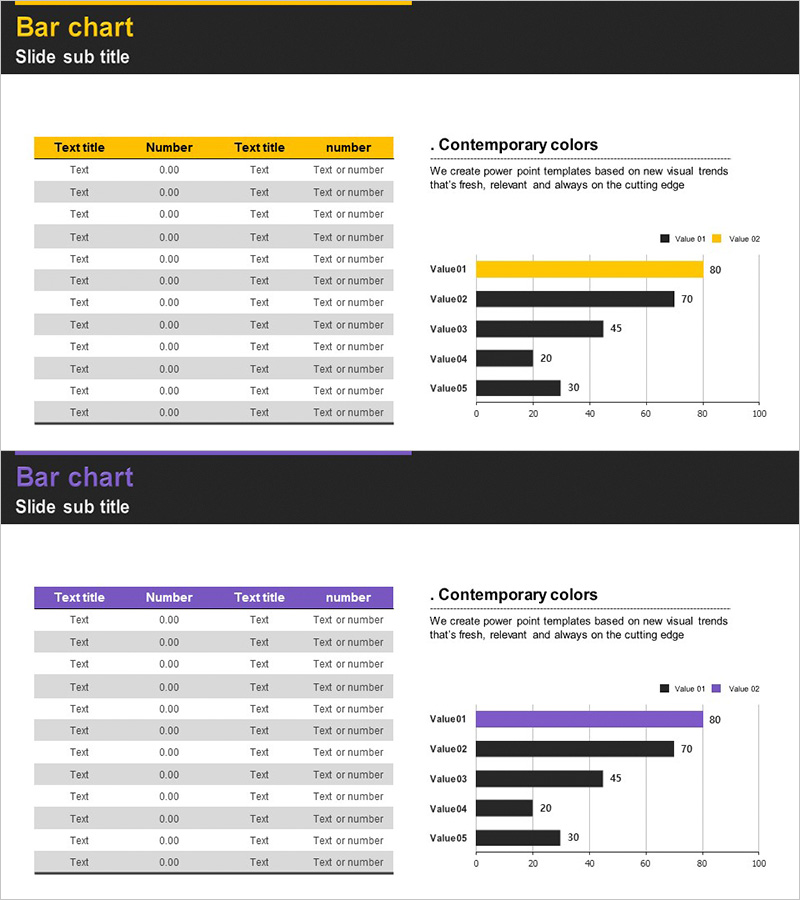
A PowerPoint slide that presents sales and profit data through both a data table and horizontal bar chart visualization. The first slide features a 10-row, 4-column table with detailed numerical values, while the second slide displays a dual-series horizontal bar chart (yellow and black bars) comparing five items to show sales versus profit performance. The chart includes a 0–100 scale axis with gridlines for precise value reading, and uses contemporary color combinations suitable for financial reports and business performance presentations. Provided in 16:9 widescreen PPTX format with fully editable text and numerical values.
Usage Points
-
Main Usage
Designed to compare and analyze financial data and business performance metrics clearly. The table presents detailed figures while the horizontal bar chart provides intuitive visual comparison of differences between items, enabling effective communication of data-driven insights to executives and stakeholders.
-
How to Use
Use in financial reports, quarterly earnings presentations, and business planning sessions to compare key metrics such as revenue, profit, and expenses. Replace table values with actual data and the bar chart will automatically adjust proportions, making it immediately ready for presentation.
-
Recommended For
Ideal for CFOs, finance managers, executives, business development teams, and marketing analysts presenting quarterly results, investor reports, and internal management meetings. Particularly effective when comparing profitability across multiple items and analyzing market performance.
-
Slide Structure
Slide 1: 10-row, 4-column data table with yellow header and alternating gray rows displaying Text title, Number, Text title, and number fields. Slide 2: Dual-series horizontal bar chart with 5 Value items (01–05) in yellow and black bars (Value 01: 80, Value 02: 70, etc.), 0–100 scale axis with gridlines. Both slides feature black header background with Contemporary colors description text area.
Related Products
-

Bar Chart Visualizing Coffee Sales Trends - Insights through Messaging
#Market and Competitor Analysis #Financial Plans and Performance #Graph
-

Button Bar Chart for Visualizing Sales Status – Competitive Advantage Analysis
#Market and Competitor Analysis #Financial Plans and Performance #Graph
-

Horizontal Bar Chart for Market Analysis – Trends and Competitive Advantage
#Market and Competitor Analysis #Financial Plans and Performance #Graph
-

Leather Material Presentation Template Horizontal Bar Graph - Sales and Competitive Analysis
#Market and Competitor Analysis #Financial Plans and Performance #Graph
