Leather Material Presentation Template Horizontal Bar Graph - Sales and Competitive Analysis
RJ0200021_10
- Last Update 04/03/2025
- File Size 6.2MB
- # of Slides 2
- File Format PPTX
- Slide Ratio 16:9
- Color
Keywords
- #Content-Based Slides
- #Design-Based Slides
- #Market and Competitor Analysis
- #Financial Plans and Performance
- #Graph
- #Competitive Advantage
- #Sales and Revenue
- #Horizontal Bar
- #Horizontal Bar Chart
- #16:9
- #horizontal bar chart PowerPoint
- #sales analysis slide template
- #5-item comparison chart
- #leather texture PPT template
- #competitive analysis PowerPoint slide
About the Product
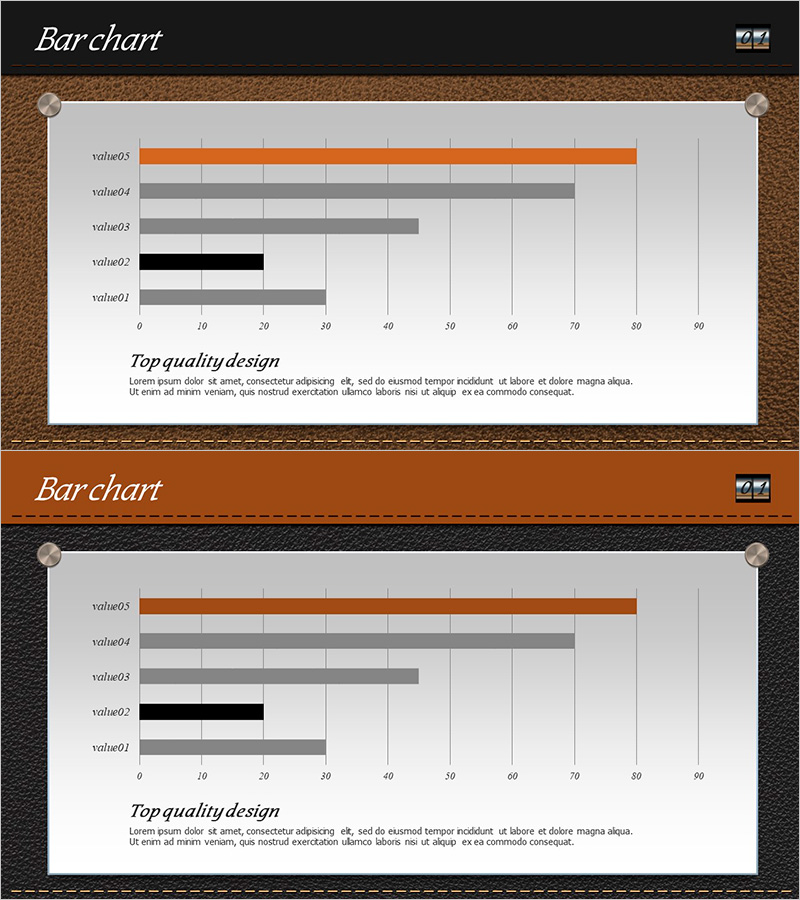
A horizontal bar chart PowerPoint slide featuring five comparable items on a brown leather texture background. Use orange, gray, and black bars to visualize sales figures, competitor performance, market share, and other metrics with clarity. This 16:9 two-slide set integrates seamlessly into business presentations, reports, and analytical decks. Each bar length directly represents data magnitude and ranking, making numerical comparisons immediately apparent. The premium leather-textured design enhances credibility and professional appearance in executive presentations.
Usage Points
-
Main Usage
Designed to compare five data points—such as sales revenue, competitor performance, market share, departmental results, or regional metrics—using horizontal bars. The bar length immediately conveys magnitude and ranking, making it ideal for financial reports, market analysis presentations, and performance reviews where side-by-side numerical comparison is essential.
-
How to Use
Input your numerical values above each bar and update the legend labels to match your dataset. The brown leather background projects a premium, professional image, while the orange accent bar highlights your key metric. All text, numbers, and bar colors are fully editable to match your brand guidelines.
-
Recommended For
Finance teams presenting quarterly or annual results, marketing teams conducting competitive benchmarking, sales teams reporting regional or product-line performance, C-suite executives reviewing business metrics, and consulting firms delivering client analysis reports.
-
Slide Structure
Two-slide set in 16:9 format. Each slide displays a five-item horizontal bar chart with three color categories: orange (primary item), gray (secondary items), and black (tertiary items). X-axis ranges from 0 to 90 with gridlines. Labels include value01 through value05. Bottom section contains 'Top quality design' descriptive area for additional context or notes.
Related Products
-

Design Style Preference Analysis – Insights into Market Competition
#Market and Competitor Analysis #Financial Plans and Performance #Graph
-

Bar Chart Analysis of Cosmetics Trends – Boosting Competitiveness
#Market and Competitor Analysis #Financial Plans and Performance #Graph
-

Horizontal Bar Chart for Market Analysis – Trends and Competitive Advantage
#Market and Competitor Analysis #Financial Plans and Performance #Graph
-

Button Bar Chart for Visualizing Sales Status – Competitive Advantage Analysis
#Market and Competitor Analysis #Financial Plans and Performance #Graph
