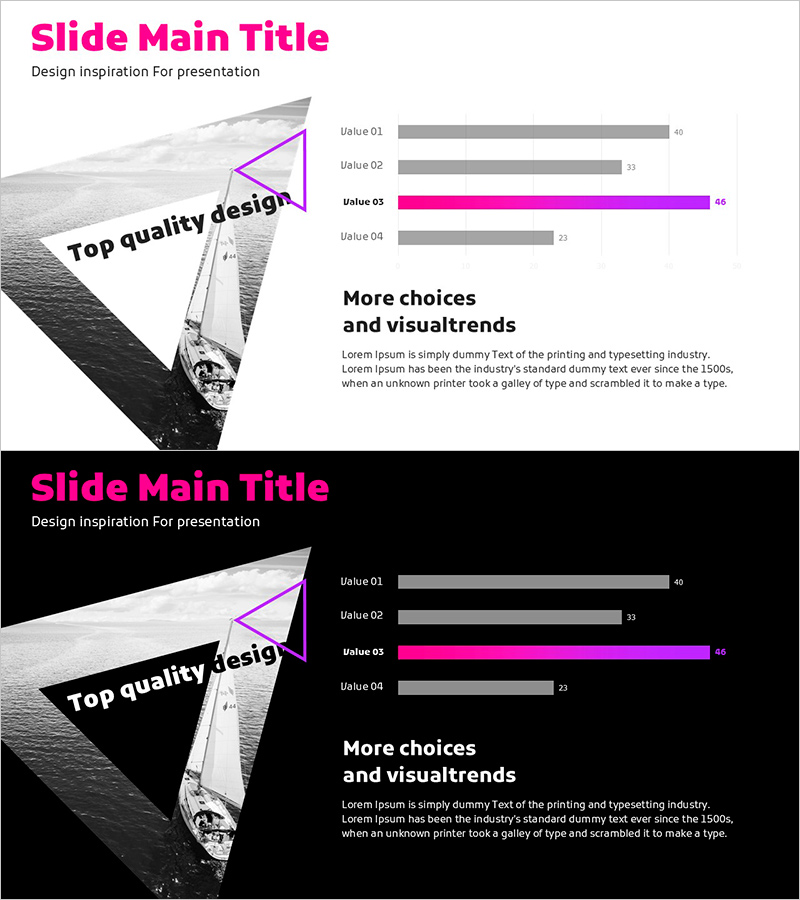
Horizontal Bar Chart for Analyzing Yacht Tour Preference
RJ0600094_21
- Last Update 07/16/2025
- File Size 0.8MB
- # of Slides 2
- File Format PPTX
- Slide Ratio 16:9
- Color
Keywords
- #Content-Based Slides
- #Design-Based Slides
- #Market and Competitor Analysis
- #Financial Plans and Performance
- #Graph
- #Competitive Advantage
- #Sales and Revenue
- #Horizontal Bar
- #Horizontal Bar Chart
- #16:9
- #horizontal bar chart PowerPoint
- #bar graph presentation slide
- #data comparison chart template
- #market analysis PowerPoint
- #preference analysis slide design
About the Product
A horizontal bar chart PowerPoint slide designed for analyzing yacht tour market preferences. This presentation template visualizes four data items with magenta accent color and gray background for strong contrast that highlights key metrics. The 16:9 widescreen format includes 2 slides ready for market analysis reports, business proposals, and competitive positioning presentations. Each bar features numeric labels for precise data communication, while background imagery and geometric shapes enhance visual impact. Fully editable PPTX format allows quick customization of values and labels to match your specific market research findings.
Usage Points
-
Main Usage
Visualizes numerical comparisons across four categories such as market research data, customer preferences, or competitive benchmarking. The magenta accent bar immediately draws attention to the highest value, enabling quick insight delivery to audiences.
-
How to Use
Edit the bar lengths and numeric values to match your dataset while keeping the background imagery and geometric design elements intact. Simply update the Value 01-04 labels and corresponding numbers, then use the slide in your presentation. The dual-background design (light and dark) allows flexibility for different presentation contexts.
-
Recommended For
Marketing professionals, business strategists, management consultants, and research analysts presenting customer preference data, market share comparisons, or sales performance metrics. Applicable across tourism, travel, consumer goods, finance, and retail industries for competitive analysis and market positioning.
-
Slide Structure
Two-slide set with identical chart structure on contrasting backgrounds. First slide features light background with magenta geometric accent and 4-item horizontal bar chart. Second slide uses black background for the same layout. Each bar displays Value 01-04 labels with numeric data (23-46 range), enabling clear comparative analysis.
Related Products
-

Bar Chart Visualizing Coffee Sales Trends - Insights through Messaging
#Market and Competitor Analysis #Financial Plans and Performance #Graph
-

Horizontal Bar Chart for Market Analysis – Trends and Competitive Advantage
#Market and Competitor Analysis #Financial Plans and Performance #Graph
-

Sales and Profit Analysis Tables & Graphs – Data-Driven Insights
#Market and Competitor Analysis #Financial Plans and Performance #Diagram
-

Design Style Preference Analysis – Insights into Market Competition
#Market and Competitor Analysis #Financial Plans and Performance #Graph
