Design Style Preference Analysis – Insights into Market Competition
RB0700030_5
- Last Update 03/17/2025
- File Size 4.2MB
- # of Slides 2
- File Format PPTX
- Slide Ratio 4:3
- Color
Keywords
- #Content-Based Slides
- #Design-Based Slides
- #Market and Competitor Analysis
- #Financial Plans and Performance
- #Graph
- #Competitive Advantage
- #Sales and Revenue
- #Horizontal Bar
- #Horizontal Bar Chart
- #4:3
- #horizontal bar chart PowerPoint
- #bar graph slide template
- #multi-series comparison chart
- #data visualization PowerPoint
- #market analysis slide
About the Product
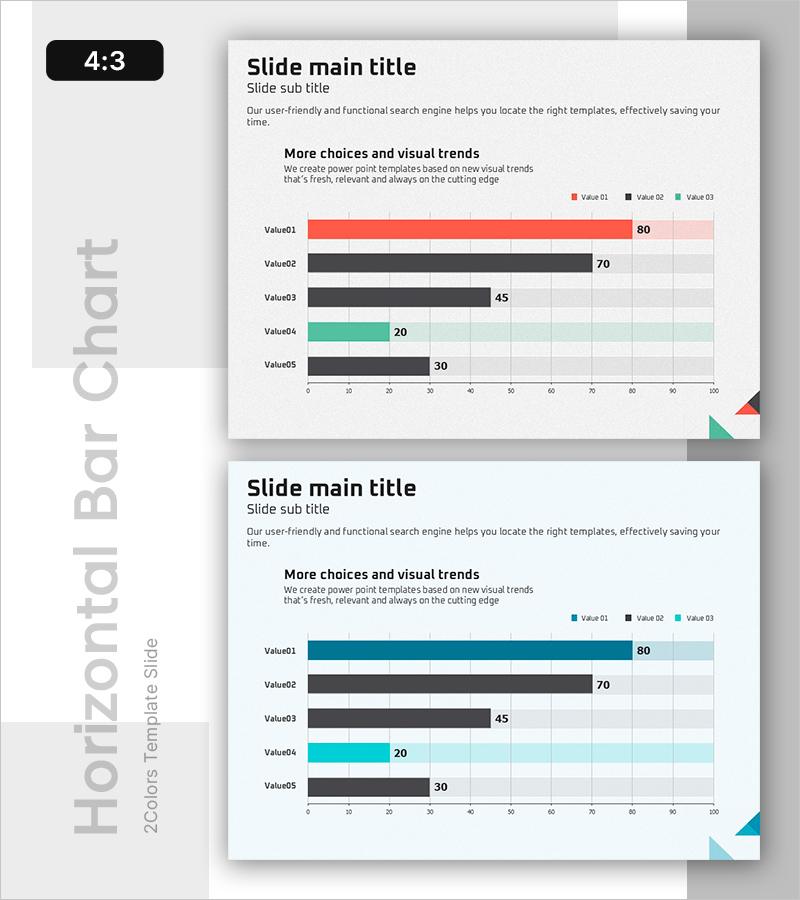
A horizontal bar chart PowerPoint slide optimized for market competition analysis and preference surveys. This presentation template compares 5 items across 3 data series (red, black, green) to visualize quantitative data intuitively. Each bar is scaled from 0 to 100 with clear value labels displayed. The 4:3 aspect ratio template includes 2 slides ready for immediate editing. Perfect for marketing analysis presentations, executive reports, and strategic planning discussions.
Usage Points
-
Main Usage
Compare quantitative data across 5 items and 3 data series simultaneously. Effectively communicate market research results, product performance benchmarks, and customer preference analysis. The bar lengths provide intuitive visual comparison of numerical differences.
-
How to Use
Insert this slide into marketing strategy presentations, executive briefings, and market analysis decks. Double-click chart elements to edit values or adjust colors to match brand guidelines. Customize title and subtitle text freely. Compatible with standard PowerPoint editing tools.
-
Recommended For
Marketing professionals, executives, consultants, and analysts presenting quantitative data. Particularly suited for competitive analysis, customer segmentation studies, and product positioning strategy presentations.
-
Slide Structure
2-slide template in 4:3 aspect ratio. First slide features vertical-oriented horizontal bar chart with 5 items (Value01–Value05) across 3 series. Scale axis ranges 0–100 with value labels (80, 70, 45, 20, 30). Second slide presents identical chart structure in horizontal layout orientation.
Related Products
-

Horizontal Bar Chart for Analyzing Yacht Tour Preference
#Market and Competitor Analysis #Financial Plans and Performance #Graph
-

Horizontal Bar Chart for Market Analysis – Trends and Competitive Advantage
#Market and Competitor Analysis #Financial Plans and Performance #Graph
-

Bar Chart Visualizing Coffee Sales Trends - Insights through Messaging
#Market and Competitor Analysis #Financial Plans and Performance #Graph
-

Sales and Profit Analysis Tables & Graphs – Data-Driven Insights
#Market and Competitor Analysis #Financial Plans and Performance #Diagram
