Simple Car Wide Presentation Area Chart
RJ0200057_26
- Last Update 04/15/2025
- File Size 0.3MB
- # of Slides 2
- File Format PPTX
- Slide Ratio 16:9
- Color
Keywords
- #Content-Based Slides
- #Design-Based Slides
- #Market and Competitor Analysis
- #Graph
- #Other
- #Market Analysis
- #Industry Trends
- #Other
- #Area Chart
- #16:9
- #area chart PowerPoint
- #area graph slide template
- #trend data visualization PPT
- #automotive presentation slide
- #how to create area chart in PowerPoint
- #area chart slide download
About the Product
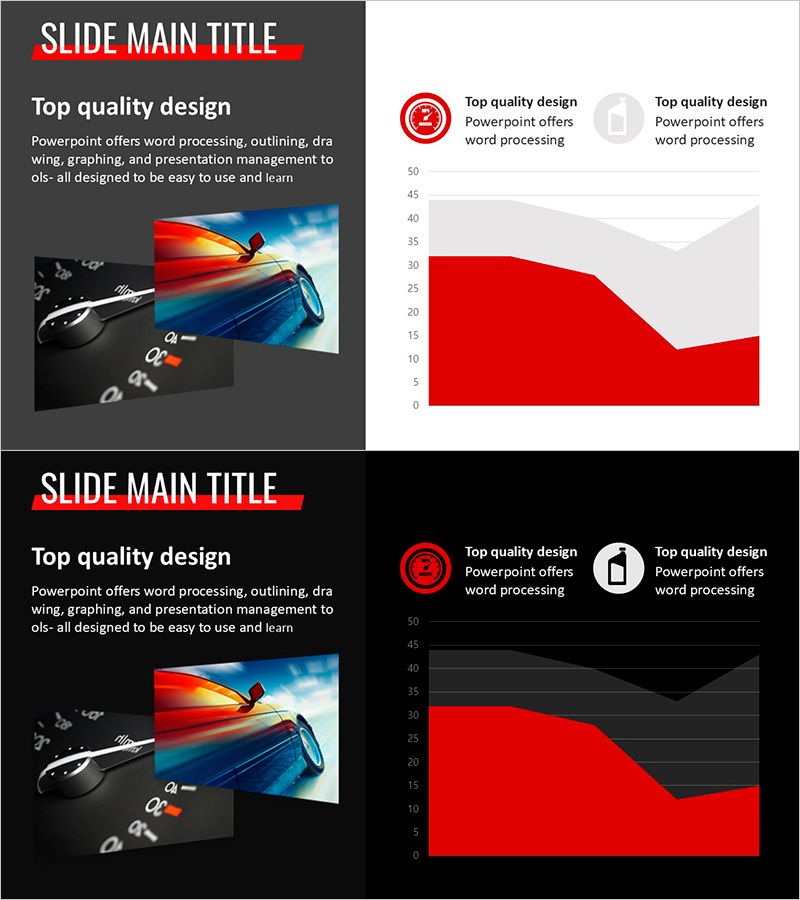
An area chart PowerPoint slide featuring an automotive motif design. The red gradient area chart with 2 data series visually represents trends and changes over time, making it ideal for market analysis, sales performance, and comparative reporting. This 16:9 widescreen 2-slide template combines dynamic car imagery with data visualization to capture audience attention. The editable chart structure allows immediate customization for presentations on sales trends, market dynamics, and performance metrics.
Usage Points
-
Main Usage
Visualize time-series data trends and comparative metrics using a 2-series area chart with red gradient styling. Effectively communicate sales performance, market trends, and performance comparisons in executive presentations and business reports.
-
How to Use
Slide 1 features the car image with the primary area chart for impactful opening. Slide 2 uses a dark background with the same chart for flexible presentation contexts. Edit the chart values and legend labels to input your actual data, then the slide is ready for immediate use.
-
Recommended For
Marketing managers, sales directors, financial analysts, and business executives presenting quantitative data. Ideal for quarterly performance reports, market trend analysis, competitive benchmarking, and strategic planning presentations.
-
Slide Structure
2-slide template. Slide 1: Light gray background + automotive image + red gradient area chart (2 series, Y-axis 0–50 range, 5 data points) + circular icon legend. Slide 2: Dark black background + identical area chart + gray gridlines + circular icon legend. 16:9 widescreen PPTX format.
Related Products
-

Modern Blue Presentation Area Chart - Optimized for Market Analysis
#Market and Competitor Analysis #Graph #Other
-

Marketing Activity Monitoring Dashboard – Market Trend Analysis
#Market and Competitor Analysis #Graph #Other
-

Management System and Area Charts – Effective Business Strategies
#Business Strategy #Market and Competitor Analysis #Diagram
-

Business Forest Wide Template Area Chart
#Market and Competitor Analysis #Graph #Other
