Market Analysis Area Graph – Risk Reduction
RJ0300009_9
- Last Update 04/20/2025
- File Size 0.1MB
- # of Slides 2
- File Format PPTX
- Slide Ratio 16:9
- Color
Keywords
About the Product
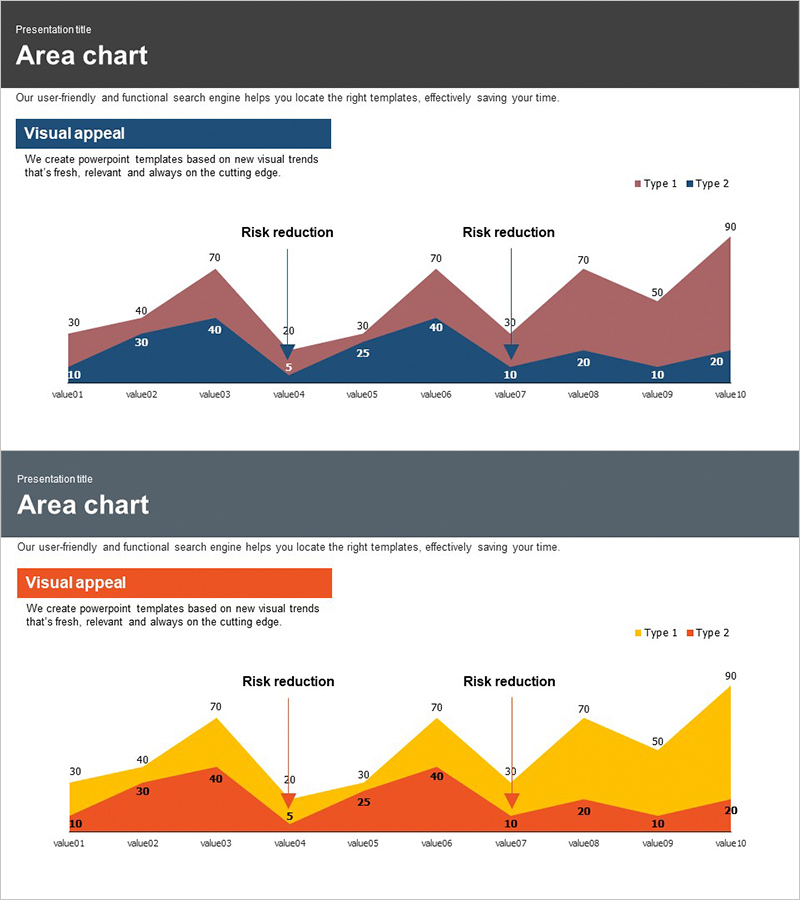
A professional dual-series area chart PowerPoint slide designed for market analysis and business performance reporting. The slide features a dark blue and wine-red stacked area visualization across 10 data points, clearly illustrating risk reduction trends over time. Each data value is labeled directly on the chart for precise comparison and reference. The 16:9 widescreen format with 2-slide composition integrates seamlessly into presentations, reports, and executive briefings. Fully editable data labels, axis values, and color schemes allow quick customization to your specific metrics.
Usage Points
-
Main Usage
Visualize two data series over time to compare trends, such as cost reduction vs. efficiency gains, or market share by segment. The stacked area format shows both individual series performance and cumulative totals, making it ideal for financial reports, quarterly reviews, and strategic performance analysis.
-
How to Use
Replace the sample data values (value01–value10) with your actual metrics. Modify axis labels, legend text, and data point numbers to match your presentation context. Colors can be adjusted to match your corporate branding. The chart is fully editable in PowerPoint—simply click and update values or formatting as needed.
-
Recommended For
Finance teams presenting quarterly earnings or cost reduction initiatives, marketing teams analyzing market penetration by segment, operations teams tracking efficiency improvements, and executives reviewing risk mitigation strategies. Effective for board presentations, investor updates, and internal performance dashboards.
-
Slide Structure
2-slide set featuring identical dual-series area chart layouts. Each slide displays a dark blue (Type 1) and wine-red (Type 2) stacked area across 10 labeled data points. Vertical reference lines mark 'Risk reduction' milestones. Data labels are positioned within each area segment for clarity and direct comparison.
Related Products
-

Comparative Analysis Area Graph – Market and Competitor Analysis
#Market and Competitor Analysis #Graph #Other
-

Business Forest Wide Template Area Chart
#Market and Competitor Analysis #Graph #Other
-

Children's Education Area Graph – Market Trends Analysis
#Market and Competitor Analysis #Graph #Other
-

Gradient Theme Area Diagram – Market and Competitor Analysis
#Market and Competitor Analysis #Diagram #Graph
